
Co-fired ceramics have a wide range of applications from their use in creating capacitors (Rodriguez and Wallace 1961), multi-layer circuits (Stetson 1965), and RF and microwave circuit substrates (Dancila et al. 2014; Lee et al. 2006; Eun et al. 2004), to micro-fluidic sensors (Birol, Maeder, and Ryser 2006, 2007; Birol et al. 2005), and a host of other sensor technologies (Jurków et al. 2015). Part of the usefulness of co-fired ceramics arises from the fact that substrates built with this technology are fabricated in an additive manner, allowing for the integration of internal structures such as inductors, capacitors, resistors, and cavities (Eun et al. 2004; Celanese Corporation 2005; Nemours 2009). The ability to build cavities, whether open-faced or buried, into the substrate of a device allows designers the option to recess and seal devices into the substrate (Nemours 2009), create microfluidic structures (Birol, Maeder, and Ryser 2006, 2007; Birol et al. 2005), integrate passive components into the substrate (Eun et al. 2004; Celanese Corporation 2005), and create resonant chambers for use in RF and microwave circuits (Dancila et al. 2014; Lee et al. 2006; Eun et al. 2004). These cavity structures often have precise requirements for dimensional control, particularly in RF, microwave, and microfluidic applications (Lee et al. 2006; Birol, Maeder, and Ryser 2006; Birol et al. 2005).
Low temperature co-fired ceramics (LTCC) technology is an attractive choice for many designs and applications, in part due to the opportunity to use metallizations such as gold and silver that have higher conductivities than metallizations that are compatible with the sintering temperatures of high temperature co-fired ceramics (HTCC) (Rodriguez and Wallace 1961; Eun et al. 2004; Celanese Corporation 2005). This along with other attributes of the technology such as the additive nature of its fabrication process, hermeticity, chemical inertness, thermal conductivity, and dielectric properties make LTCC a popular choice for microelectronics packaging, micro-fluidic device fabrication, and RF and microwave applications (Dancila et al. 2014; Lee et al. 2006; Eun et al. 2004; Birol, Maeder, and Ryser 2006, 2007; Birol et al. 2005).
A significant challenge to fabricating cavity structures free from defects such as sagging and delamination arises from the necessities of processing co-fired ceramics, namely the lamination and firing steps (Birol et al. 2005; Espinoza-Vallejos et al. 1998; Khoong, Tan, and Lam 2009; Maeder et al., n.d.; Bartsch de Torres et al. 2010; Bartsch de Torres, Hintz, and Thelemann 2006; Kita et al. 2002). Lamination pressures from ~7 MPa to ~35 MPa used during the lamination process are known to cause sagging in unsupported cavity structures above a certain size (Espinoza-Vallejos et al. 1998; Khoong, Tan, and Lam 2009), and the softening of the glass content during firing can also allow the structure to deform (Birol et al. 2005; Maeder et al., n.d.). While a number of methods and techniques have been developed to mitigate these issues (Espinoza-Vallejos et al. 1998; Maeder et al., n.d.; Bartsch de Torres et al. 2010; Bartsch de Torres, Hintz, and Thelemann 2006; Kita et al. 2002), the focus of this study was on creating hermetic, buried cavities targeting fired cavity dimensions of 6.35 mm on a side and 12.7 mm on a side using fugitive carbon tape as the primary support technology as per the work performed in Birol, Maeder, and Ryser (2006, 2007; Birol et al. 2005). While the work performed in Bartsch de Torres et al. (2010; Bartsch de Torres, Hintz, and Thelemann 2006) has demonstrated very successful results using low lamination pressures to allow for shrinkage during sintering to counteract the deformation resulting from the lamination process, the authors’ previous experience in fabricating unsupported, open-faced cavities with high lamination pressures suggested that a combination of high lamination pressures and fugitive carbon tape was an avenue worthy of investigation.
Much work has been performed investigating the efficacy and processing requirements of using fugitive carbon material to support cavity structures in LTCC, and these structures often have direct exposure to the furnace environment during firing through either open-faced cavities or ports included as part of the functionality of the device being fabricated. However, in certain applications, such as accelerometers in devices operating in harsh gas or fluid environments, it is desirable to create cavities that are completely sealed off from the surrounding environment. This poses a particular challenge to using fugitive carbon to support these structures, as removing direct exposure to the furnace environment during firing limits the avenue of gas exchange between the cavity and furnace atmosphere to existing pores in the LTCC, which become closed upon completion of the sintering process (Birol, Maeder, and Ryser 2006, 2007; Birol et al. 2005).
This study seeks to develop and investigate methods and processes to mitigate deformation and allow for precise and repeatable dimensional control of blind, buried cavities in LTCC substrates. Specifically, this work investigates the effects of different firing profiles, lamination pressures, the use of fugitive carbon tape, the use of a custom lamination fixture, and a commercially available lamination adhesive on the deformation and reduction of defects in blind cavities fabricated within an LTCC substrate. The effects of these on the fabricated cavities were assessed and measured using contact profilometry and optical microscopy.
II. Experimental Setup
Two sets of eight coupons each were fabricated using sheets of 254 μm thick, unfired LTCC tape (Celanese Micromax 951PX) and 254 μm thick fugitive carbon tape (C12 Advanced Technologies TCS-CARB-1UP). Each coupon was comprised of eleven layers of LTCC tape according to a common process flow of blanking, preconditioning, punching, via filling, collating, vacuum sealing for isostatic lamination, laminating, trimming/singulating, and firing. Note that the screen-printing step is not included in the above process flow as the only metallization used was for the creation of silver vias used for reference in cross-sectioning. The process flow for the fabrication of each set of coupons differed in the collation step in which the carbon tape, custom lamination fixture, and lamination adhesive were introduced. The carbon tape inserts were cut with a laser and were inserted into the middle (sixth) layer of tape when they were included in the coupon.
Two sizes of cavities were included in each set of coupons. The nominal sizes of the cavities punched into the unfired tape were 14.6355 mm x 14.6355 mm x 0.254 mm and 7.3178 mm x 7.3178 mm x 0.254 mm. The corresponding carbon tape inserts were cut to the same nominal dimensions for each cavity size. These dimensions and process steps are common to each set of coupons. Specific alterations to the fabrication process for each set of coupons will be covered in the following subsections.
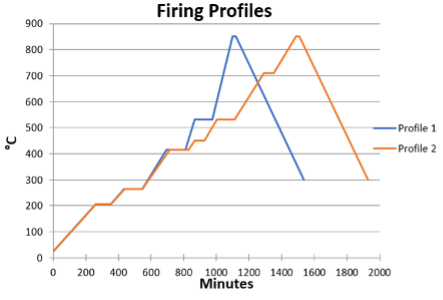
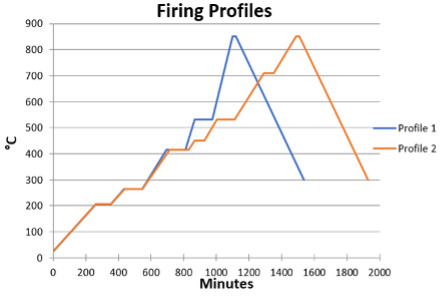
Coupons from each set were fired according to one of two different firing profiles shown in Fig. 1. Profile 1 is provided by DuPont (Nemours 2009) and is the recommended profile for builds greater than 0.070" (1.778 mm) in thickness and for increased dimensional stability. Profile 2 is based on Profile 1 but utilizes two additional dwell times as well as ramp rates no greater than 1°C min-1 up to the peak temperature. Specifically, an hour-long dwell time was added at 450°C to allow extra time for the organics in the LTCC tape to completely burn out based on Birol et al. (2005) and C12 Advanced Technologies (n.d.), and an hour-long dwell time at 710°C was added based on the carbon tape manufacturer’s recommendations (C12 Advanced Technologies, n.d.). The work performed in Birol, Maeder, and Ryser (2006, 2007; Birol et al. 2005) found that reduced heating rates led to decreased swelling in cavities created using fugitive carbon paste by allowing more time for the carbon to volatize and degas through the LTCC before complete closure of pores within the surrounding tape layers. While the authors in Birol, Maeder, and Ryser (2007) report on heating rates as low as 1.75°C min-1, work performed in Tan et al. (2008) evaluated the effects of heating rates as low as 1°C min-1 on the carbon burn-off kinetics of fugitive carbon tape used to support cavity structures in LTCC. The cavity structures fabricated in Birol, Maeder, and Ryser (2007) were not completely blind due to inclusion of ports to the cavity while cavities fabricated in Tan et al. (2008) were blind, although made with a different LTCC system than that currently under study. As such, a heating rate of 1°C min-1 was chosen for the modified profile based on the results of Birol, Maeder, and Ryser (2006, 2007; Birol et al. 2005), and Tan et al. (2008).
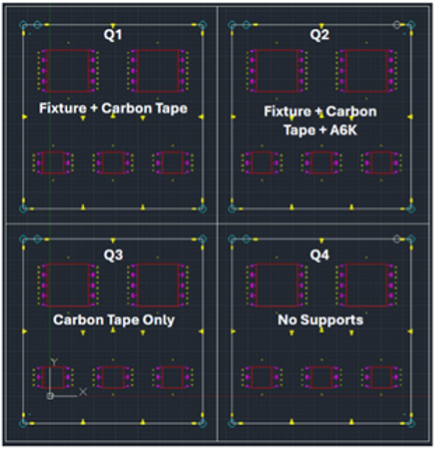
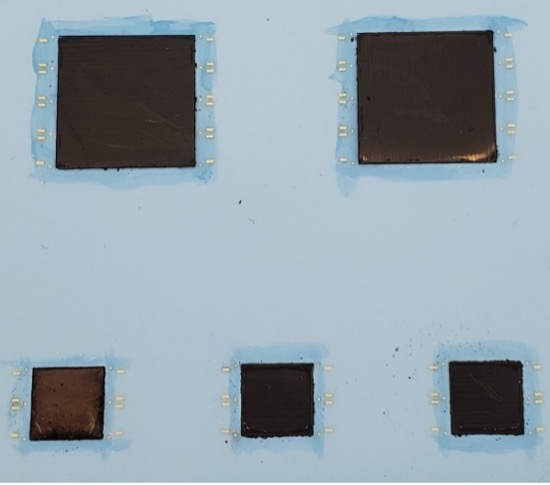
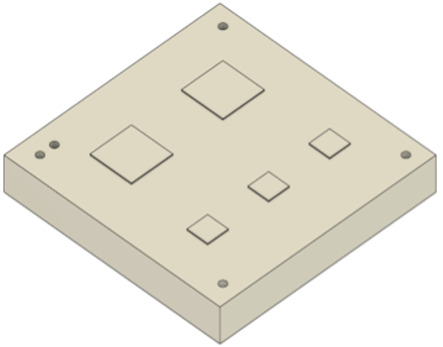
Each of the two sets was fabricated in the same manner and investigated the same cavity supports and lamination aids in order allow direct comparisons between Profiles 1 and 2. As such, the following discussion of the build processes will be broken down according to the cavity supports and lamination aids common to both sets of coupons. Each 152.4 mm x 152.4 mm panel was divided into four quadrants, which were cut down to 76.2 mm x 76.2 mm following the via filling process. Each quadrant received a different combination of cavity supports and lamination aids to evaluate the effectiveness of each. Fig. 2 shows the CAD artwork used to create the test coupons and lay out the combinations of supports and aids. Also shown in Fig. 2 are the locations of holes punched in the top and bottom layers as reference points for measuring shrinkage as well as the location of where metallized vias were created through the entire stacks as references for cross-sectioning.

Quadrant 1 incorporated the custom lamination fixture, discussed in detail below, and carbon tape. Quadrant 2 utilized the same supports as quadrant 1, but with the addition of a lamination adhesive, discussed below, on either side of the cavity tape layer. Quadrant 3 utilized the carbon tape inserts only, and quadrant 4 did not use any cavity supports or lamination aids.
The experimental design for each set made use of a custom lamination fixture. This fixture was made from Teflon and was milled to create a positive relief on the face of the Teflon block that matched the corresponding cavity outlines shown in Fig. 2. The positive relief sections of the Teflon block were milled to match the nominal unfired dimensions of the cavities. Additionally, alignment holes corresponding to those used in the aluminum lamination plates were drilled into the Teflon lamination fixture. Fig. 3 shows a model of the Teflon lamination fixture used in quadrants 1 and 2.
Also investigated in each set was an A6K lamination adhesive offered by Vibrantz Technologies (Vibrantz Technologies 2021). This product was developed as an aid to lamination at recommended pressures much lower than those utilized in the current study: 750 psi (5.17 MPa) in the data sheet vs. the 20.68 MPa – 27.58 MPa utilized in this study. However, delamination events seen in previous cavity coupons suggested that this material was still an avenue worth exploring. The lamination adhesive was applied by hand to both sides of the tape containing the cavity cutout during collation.
All coupons were built using a multi-step lamination sequence. The use of a multi-step lamination sequence was required to investigate the effectiveness of the rigid Teflon insert in mitigating deformation of the walls into the cavity as well as its effectiveness in promoting better joining of the layers comprising the “floor” of the cavity and the layer comprising the walls. Additionally, previous work by the authors performed on fabricating unsupported, open-faced cavities indicated that the “floor” of the cavity showed less deformation when it was laminated at a pressure higher than that used to subsequently join the wall layer(s) to the floor. Fig. 4 gives a diagram of the tape stack as well as the lamination sequence and pressures utilized during fabrication, and Table I shows the supports and firing profiles used in Sets 1 and 2. Tapes 1–6 were laminated together at 27.58 MPa for 10 minutes at 70°C, as were tapes 7–11. Once the carbon tape (if used) was placed in the cavity cutouts of tape 6, the completed stack was laminated together at 20.68 MPa for 10 minutes at 70°C.
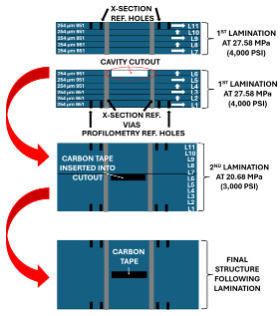
In order to fabricate the coupons in quadrants 1 and 2, the Teflon lamination fixture was placed onto the aluminum lamination plate and aligned with registration pins. Layer 6 (the cavity layer) was then placed on the lamination fixture. Each cavity cutout was then seated against the lamination fixture by hand, and then collation was performed per Table I. Fig. 5 shows the Teflon fixture in place in the Layer 1–6 stack.

Once layers 1–6 and 7–11 were laminated at 27.58 MPa, the carbon tape inserts were placed into the appropriate cavities. The complete stack was then collated and laminated per Table I.
Following the final lamination process, individual cavity coupons were singulated using a hot knife cutter. After this, one large cavity coupon and one small cavity coupon from Set 1 were fired according to Profile 1, and one large cavity coupon and one small cavity coupon from Set 2 were fired according to Profile 2.
The build process for coupons in quadrants 2, 3, and 4 followed the same procedure as outlined for those in quadrant 1, apart from application of the A6K lamination adhesive for quadrant 2. This was manually applied to the top and bottom with a brush around the edges of each cavity in the collation step. Fig. 6 shows layer 6 with the carbon tape inserts placed in the cavities and A6K applied around the cavity edges. Collation, lamination, singulation, and firing were then conducted per Table I in the same manner as for quadrant 1.

III. Results
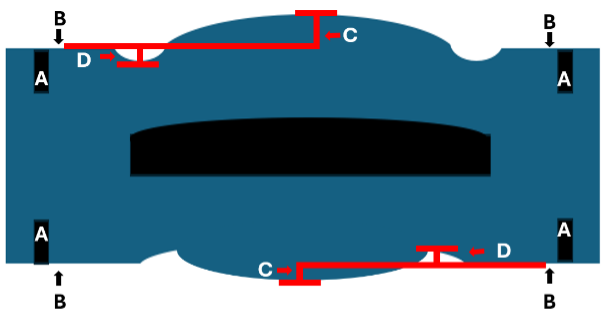
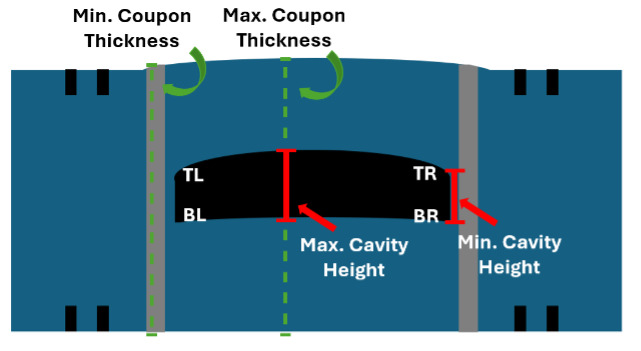
Prior to cross-sectioning Sets 1 and 2, the variation in surface topography on both the top and bottom of the coupons was taken with a contact profilometer. These scans were taken within approximately +/- 110 μm of the as-designed middle of the cavity using a set of holes punched into the top and bottom tape layers of each coupon as references. The areas of the coupons just inside the bounds created by these reference holes were set as the reference points for the profilometry scans. Fig 7. shows an exaggerated diagram of a fired cavity coupon with the references and parameters labeled, and the height and depth of the scans in Tables II and III are in respect to these.

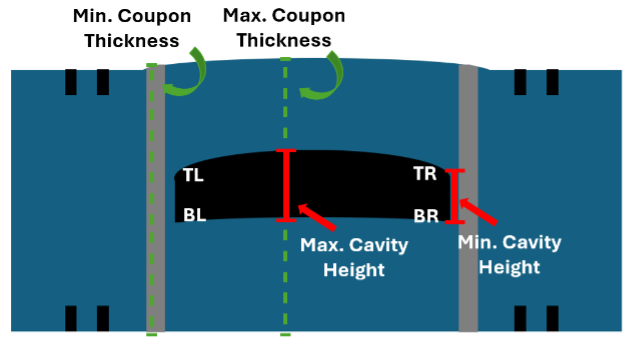
Following profilometry measurements, all coupons were prepared for cross-sectioning and optical inspection such that the cross-sectional view was perpendicular to the profilometry scans. Each coupon was cut with a wafering saw, encapsulated in epoxy, and ground down to within approximately +/- 110 μm of the as-designed middle of the cavity by utilizing the metallized vias created along the edges of the cavity as references. Following this, the samples were polished for optical inspection, and the maximum and minimum heights of the cavities were measured, as were the maximum and minimum thicknesses of the overall coupon at the location of the cavity. Fig. 8 shows the defect location codes as well as the relative locations of the cavity and coupon measurements. The difference in cavity heights is the difference between the maximum cavity height and minimum cavity height, and the difference in coupon thicknesses is the difference between the maximum coupon thickness at the cavity and the minimum coupon thickness at the cavity. Tables II and III give the profilometry data for Sets 1 and 2, respectively. Cavity and coupon data for Sets 1 and 2 are given in tables IV and V, respectively.
Comparing the changes in maximum surface variation from the profilometry scans from Set 1 to Set 2 shows mixed results. Top side deformation decreased across six of the eight large cavity coupons (coupons 1, 2, and 3 to coupons 9, 10, and 11). However, top side deformation increased across all eight small cavity coupons (coupons 5–8 to coupons 13–16). Bottom side deformation decreased across 10 of the coupons, with increased deformation found when comparing coupons 1, 5, and 7 to coupons 9, 13, and 15.
Comparing the change in maximum variation in cavity height from Set 1 to Set 2 again gives mixed results. Maximum variation in cavity height decreased from coupons 1, 2, 3, and 8 to coupons 9, 10, 11, and 16, while the variation increased for the remaining coupons.
Comparing the maximum variation in coupon thickness at the cavity from Set 1 to Set 2 also shows similar outcomes. Maximum variation in coupon thickness decreased from coupons 2 and 3 to coupons 10 and 11, while the maximum variation in coupon thickness increased for all others.
It is hypothesized that the maximum variation in cavity height is, at least in part, the result of the “floor” and “ceiling” of the cavity coupons being deformed into the cavity during lamination followed by entrained gas then deforming the “floor” and “ceiling” out past the surrounding material during the final stages of the firing process. The presence of defects in a cavity also contributes to the magnitude of this parameter. As such, this parameter would be a measure of the effects of the combination of factors influencing the final dimensions of the cavity. Along with the difference in cavity height, the height differences found during contact profilometry would be a measure of the effects of the combined factors contributing to the final shape and dimensions of the cavity then causing deformation of the ceramic material around the cavity.
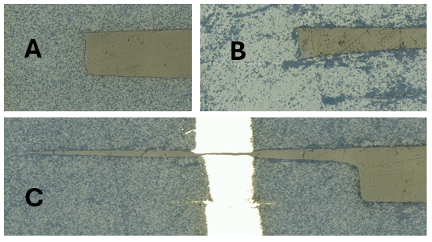
Severe defects were found in coupons 1, 3, 5, and 7 as well as the comparable coupons 9, 11, 13, and 15. These primarily consist of large gaps between layers 6 and 7, with layer 6 containing the cavity and layer 7 being the “ceiling” of the cavity. While defects were observed in the remaining coupons, the difference in severity is pronounced. The better performance of coupons 2, 6, 10, and 14 is likely due to the inclusion of the A6K lamination adhesive. Although coupons 4, 8, 12, and 16 were deformed due to lack of supports during lamination, they also did not show the severe defects present at the interface of layers 6 and 7. Fig. 9 shows examples of the defects found in coupons 2, 3, and 4.
_coupon_2__left_wall._b)_coupon_4__left_wall__c)_coupon_3__left_wall.png)
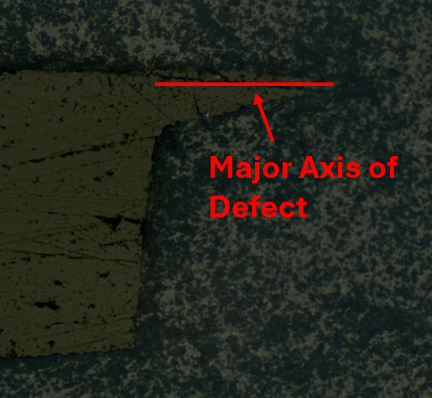
As the walls of certain cavities are not completely straight and perpendicular to the “floor” or “ceiling” of the cavity, it is difficult to establish a reference point consistent across all 16 coupons to compare the exact length of the defects from one coupon to the next. The authors thus quantified the defects by classifying them into ranges of lengths. Fig. 10 illustrates the challenge of determining an exact reference point for the lengths of the defects and shows the dimension of the defect measured in tables VI and VII. This dimension will be referred to as the “major axis” of the defect for the purpose of discussion in this paper.
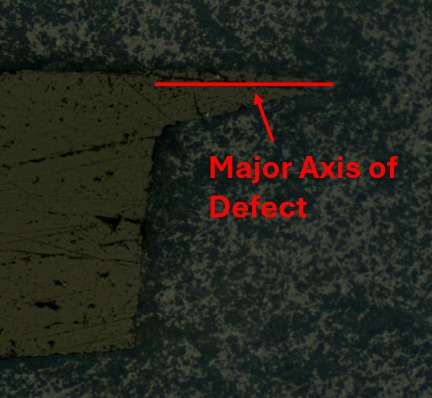
The location of the defects was recorded and coded based on the corner of the cavity in which they appeared. The coding for the location of the defects is as follows: TL = top left corner of cavity, TR = top right corner of cavity, BL = bottom left corner of cavity, and BR = bottom right corner of cavity. Seven ranges of the length of the major axis of the defects are used to classify defects in the cavity coupons and are as follows: T = <100 μm, U = 101 μm – 400 μm, V = 401 μm – 700 μm, W = 701 μm – 1,000 μm, X = 1,001 μm – 1,300 μm, Y = 1,301 μm – 1,600 μm, and Z = 1,601 μm – 1,900 μm.
While gas entrainment in the cavities of coupons 1, 3, 5, 7, 9, 11, 13, and 15 could explain the severe defects at the layer 6–7 interface, consideration of the multi-step lamination process suggests a different explanation. Layers 1–6 of each coupon were laminated at 27.58 MPa before the carbon tape was placed. Layers 7–11 were laminated at 27.58 MPa separately before the whole stack was laminated at 20.68 MPa. As the carbon tape was never subjected to the same peak pressure as the surrounding LTCC material, it is hypothesized that the carbon tape was not compressed to the same degree as the surrounding material, therefore preventing complete lamination of layers 6 and 7.
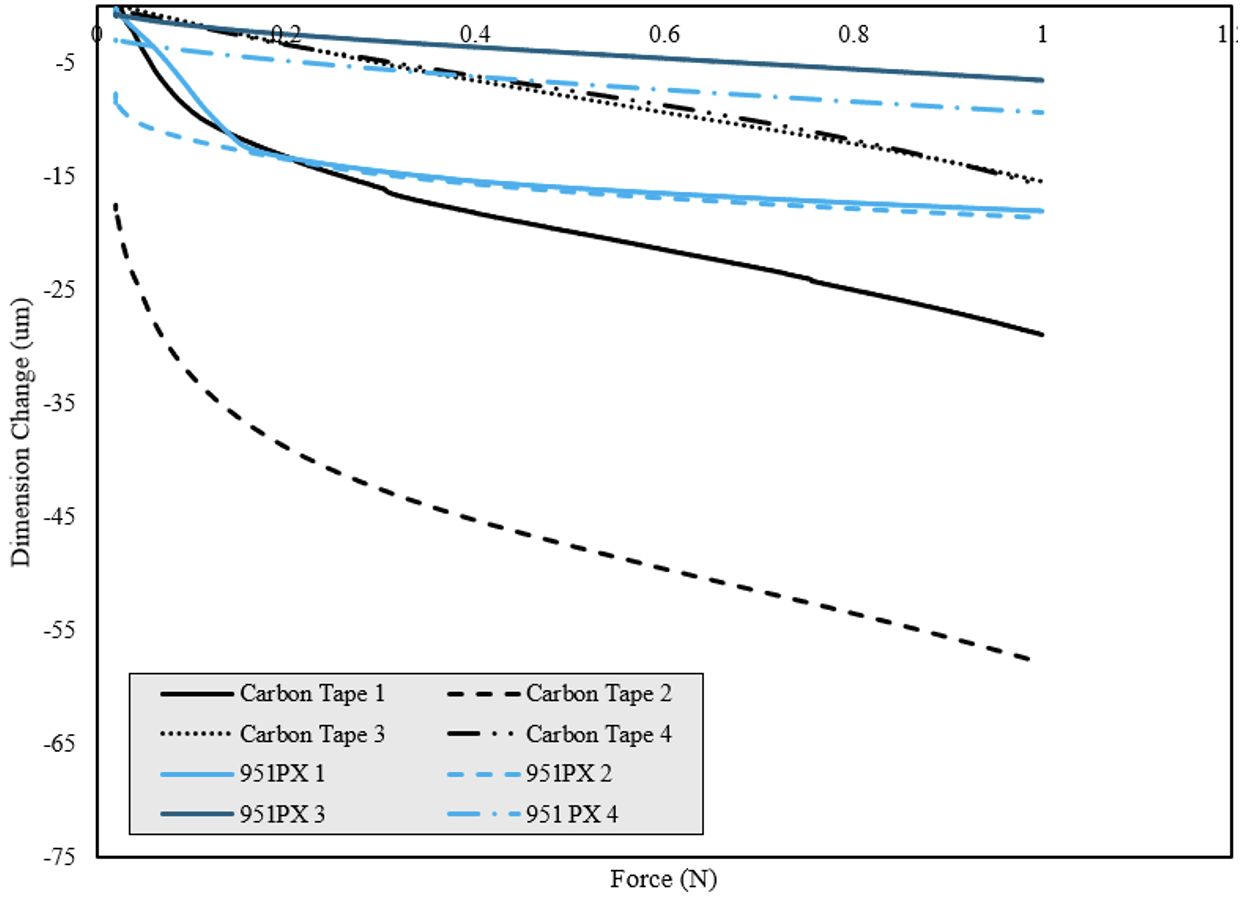
Following measurement and analysis of the results from both sets of coupons, compression data for samples of the 951PX GreenTape™ and the carbon tape were collected. Four samples of each material were taken from the same material lots used in the fabrication of the test coupons. Compression data was collected using a thermomechanical analyzer with the samples heated to 70°C and subjected to force ranging from 0.02 N to 1 N with a force ramp rate of 0.1 N/min.
From Fig. 11, it can be seen that there is a wider range of compressibility among the four carbon tape samples compared to the four 951PX samples. Carbon Tape 2 saw a dimensional change of ~39.9 μm, while Carbon Tape 4 saw a dimensional change of ~15.4 μm. 951PX 1 saw a dimensional change of ~17.5 μm, while 951PX 3 saw a dimensional change of ~5.7 μm. Also worth noting is that Carbon Tape 3 and Carbon Tape 4 saw less dimensional change than 951PX 1, although the difference between the two carbon tape samples and 951PX 1 is only ~2 μm.

While the compressibility data taken on the carbon tape and 951PX samples indicates that the carbon tape sees a greater degree of dimensional change for a given amount of applied force compared to the 951PX, additional work will need to be performed before the authors’ hypothesis that the source of the severe defects is due to a difference in compression between the GreenTape™ and carbon tape used to fabricate Sets 1 and 2 coupons is confirmed.
IV. Conclusion
While the overall results of the study were mixed, the findings suggest a number of paths forward to minimize the deformation of LTCC substrates fabricated with blind, buried cavities.
Future work will be undertaken to better understand the impact of the hypothesized compression mismatch between the cavity-containing layer and the carbon tape inserts. To enable direct comparison to coupons fabricated in this study (specifically those fabricated only with carbon tape in quadrant 3), a set of coupons will be fabricated in the same manner as those in quadrant 3, with the only change being moving to a single lamination step at 27.58 MPa.
While the authors’ experience suggested that laminating the “floor” and “ceiling” layers of the cavity at higher pressures than those used to laminate the completed stack would show less deformation than stacks laminated in a single step at the same pressure, the literature shows that many researchers, particularly those in Bartsch de Torres et al. (2010; Bartsch de Torres, Hintz, and Thelemann 2006) have made use of significantly lower lamination pressures that those used in the current study in order to use the shrinking during sintering to counter the deformation resulting from the lamination process. As such, this is another area in which work will be performed to make use of these findings in future work on building buried and hermetic cavities in LTCC substrates.
Additionally, the A6K lamination adhesive investigated in quadrant 2 coupons showed a marked mitigation of the severe defects found in quadrant 1 and 3 coupons. Given the reduction in the severity of defects in coupons utilizing this material, further exploration of its application in similar structures is warranted.
The effects of the rigid Teflon fixture on cavity deformation are unclear from the results of this study. This technique may have merit, but its effectiveness, if any, can be better investigated once the source of the severe defects found in this study is identified.
While a comparison of the effects of the two firing profiles used in this study does not clearly show the superiority of one over the other, it is possible that the severe defects found in many of the coupons obscured any clear difference between the two. As the weight of the literature indicates that the low heating rates and added dwell times in Profile 2 reduce deformation of cavity structures in LTCC (Birol, Maeder, and Ryser 2006, 2007; Birol et al. 2005; C12 Advanced Technologies, n.d.; Tan et al. 2008), this is another area in which further work will be performed.
This study investigated the effects of manipulating a range of process parameters on the outcomes of cavity deformation and defects in LTCC substrates. Two firing profiles, a multi-step lamination process, and multiple different support technologies and techniques were explored and evaluated. Although the findings of this study do not provide a specific recipe for creating defect-free cavities in LTCC substrates, the results of this study do provide a baseline for these efforts and suggest multiple avenues for future work in the area.