


I. Introduction
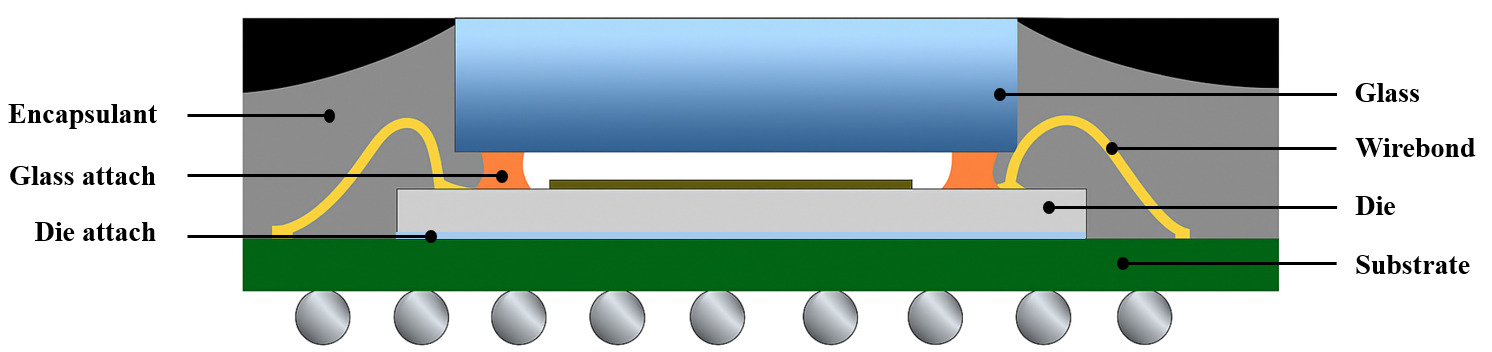
Image sensors are integral components in rapidly evolving technologies, including mobile phones, autonomous vehicles, and medical imaging devices. For example, sensors in autonomous vehicles provide accurate and reliable images for object detection, lane keeping, and other critical safety functions (Yeong et al. 2021). Because these applications demand increasingly higher levels of performance, they require high image fidelity. Image sensors are usually sensitive to warpage and misalignment, which will impact the accuracy of sensors in capturing the real-world scene (Wilke et al. 2011). Even minor distortion can significantly degrade image quality, impacting the overall effectiveness of the final product. One of the solutions is to shield it with encapsulant materials. Encapsulants can help minimize the warpage induced from coefficient of thermal expansion (CTE) mismatch and distribute stresses to reduce the risk of cracking or delamination. The choice of encapsulant material and its properties is critical in the design and manufacturing of image sensor packages. However, choosing the right encapsulant material involves time-consuming design of experiments (DOE) that can hinder the innovation cycle and prolong the time to market. Given the design and testing complexities, mechanical analysis using the finite element analysis (FEA) offers a cost-effective and faster alternative for evaluating various factors and their interactions with the package (Rajmane et al. 2021). Accurate modeling and prediction of package warpage are crucial for both optimizing the optical performance of image sensors and ensuring their long-term functionality. A typical image sensor package is illustrated in Fig.1.
The literature review is organized as follows: we start with literature review on image sensor packaging, followed by literature review with emphasis on encapsulant, next we review literature with a focus on cure shrinkage modeling, finally we review literature on viscoelasticity.
For image sensor packaging, Zheng et al. (2022) addressed the challenges during the Chip-on-Board (COB) packaging of large-size CMOS Image Sensor (CIS) chips. The authors designed four different glue patterns and used fluid-structure interaction simulation to analyze these patterns. The optimization successfully minimizes chip warpage and improves bond strength. Zhou et al. (2020) developed a reliable, high-performance 3D Wafer-Level Chip Scale Package (WLCSP) specifically for Backside Illuminated (BSI) CMOS Image Sensors intended for automotive applications. Their work used FEA to evaluate different structural designs and optimize parameters to improve reliability and reduce stress, especially in the redistribution layer (RDL). For literatures that emphasize encapsulant, Kang et al. (2019) reviewed and compared different image sensor packaging solutions e.g. ceramic-based, lead frame-based and laminate-based packages. Their paper highlighted the advantage of using dam and liquid encapsulant material over traditional molding that results in fewer assembly steps, cost reductions, and lower stress. Jia et al. (2019) used a thermal analysis to study the heat dissipation by encapsulant, and a mechanical analysis for package warpage. Their simulation results showed a stress concentration at the center of the glass lid due to encapsulant where actual glass cracks occurred in experiment as well.
For cure shrinkage modeling, Baek et al. (2022) measured the cure shrinkage of encapsulant in experiments and used FEA simulation to predict the warpage induced by cure shrinkage. They concluded that cure shrinkage must be considered for simulated warpage to match experimental results, but their structure was limited to a simple bi-material strip with encapsulant and aluminum, which is not so applicable to semiconductor packaging or image sensors. Loh et al. (2018) performed mechanical analysis to study the impact of cure shrinkage and viscoelasticity on package warpage. They claimed that cure shrinkage played a significant role in determining the final package warpage. Moreover, their research showed that conversion rate of reaction also affected the glass transition temperature (Tg). Consequently, the evolving Tg caused more warpage than using a constant Tg in simulation. Phansalkar et al. (2020) presented a technique using an embedded Fiber Bragg Grating (FBG) sensor to measure the volumetric effective cure shrinkage (ECS) of dual curable adhesives, which are critical in image sensors and camera module assembly. The study defined ECS as the volume change accumulated only after the gel point, which is the portion responsible for generating cure-induced residual stress in package.
For literature that studied viscoelasticity, Wang et al. (2022) focused on the viscoelastic simulation of stress and warpage in memory chip 3D-stacked package. The study used FEA incorporating a viscoelastic constitutive model for the Epoxy Molding Compound (EMC). Their results demonstrated that the viscoelastic model is more accurate than a simple linear elastic model for predicting warpage and stress, and they found the maximum stress generally occurs at the interface between the lowest chip and the adhesive, decreasing from the bottom to top chip layer. Cheng et al. (2020) presented a viscoelastic FEA model to accurately characterize the warpage evolution of a Fan-Out Wafer-Level Packaging (FOWLP) during the entire wafer-level mold cure process. The researchers used a combination of viscoelastic properties and process simulation to precisely track the out-of-plane deformation. The study highlighted the crucial role of the time- and temperature-dependent viscoelastic behavior of the EMC, demonstrating that incorporating this property into the model is essential for accurate warpage prediction, which is a major challenge for manufacturing yield and subsequent assembly of FOWLP. Yeh et al. (2017) addressed the crucial issue of warpage in Fan-Out Packages (FOPs) by focusing on the viscoelastic relaxation of the EMC during the curing process. The authors developed an integrated FEA process that includes a cure-dependent viscoelastic constitutive model for EMC. The study successfully characterized and modeled the warpage evolution over the entire molding process, finding that the predictions agree well with in-line warpage measurements. Critically, the work demonstrated that tailoring the curing process conditions (time, temperature and curing stages) can be useful to optimize and improve the warpage behavior, which is essential for enhancing manufacturing yield assembly reliability. Other literature that studied the impact of viscoelastic material behavior on interfacial strength and adhesion, or for fatigue life prediction in electronic assemblies, can be found in Shirangi et al. (2009) and Shen et al. (2015) but will not be detailed here.
This paper addresses the limitations of prevailing simulation on image sensors by presenting a novel simulation approach that incorporates the modeling of cure shrinkage. Cure shrinkage modeling is often not supported in standard FEA packages, and so they typically must develop their own user subroutine to characterize the conversion rate of reaction and their impact on modulus, etc. As a result, most studies focus on thermal mechanical analysis without considering cure shrinkage impact, and the prediction accuracy is not ideal. In this work, we developed a simplified and practical cure shrinkage modeling method that can be easily integrated with traditional mechanical analysis and implemented in most standard FEA packages. This is important because conventional cure shrinkage modeling typically requires extensive experimental calibration to determine empirical coefficients, and the accuracy of these coefficients heavily rely on high-quality isothermal DSC data, which can be easily affected by noise and temperature control issues. Our proposed method avoids these complexities and reduces dependency on large experimental datasets while maintaining predictive accuracy. This makes the method more robust, cost-effective, and accessible for industrial applications, where time and resources for extensive calibration are often limited. With this approach, the impact of cure shrinkage on warpage and stress is evaluated. The improved accuracy of this approach is validated through a strong correlation between simulation results and experimental warpage data. Furthermore, this work investigates the influence of the encapsulant’s viscoelastic properties on package deformation, comparing time-dependent behavior with elastic solutions. Finally, a comprehensive design of experiments (DOE) is conducted in simulation to evaluate the effects of varying encapsulant material properties on the susceptibility of the package to glass cracking. The results of this study provide valuable insights for enhancing the accuracy of warpage predictions in simulations, particularly due to cure shrinkage, and improving the understanding of encapsulant material behavior, ultimately facilitating the design of more reliable and robust image sensor packages.
II. Methods
A. FEA model
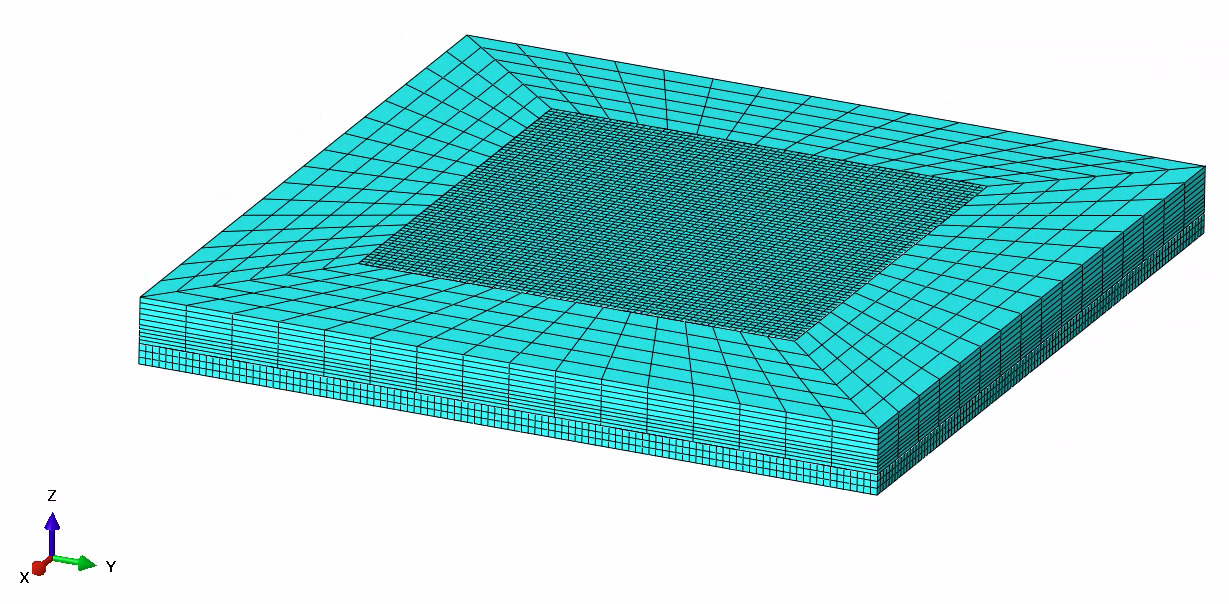
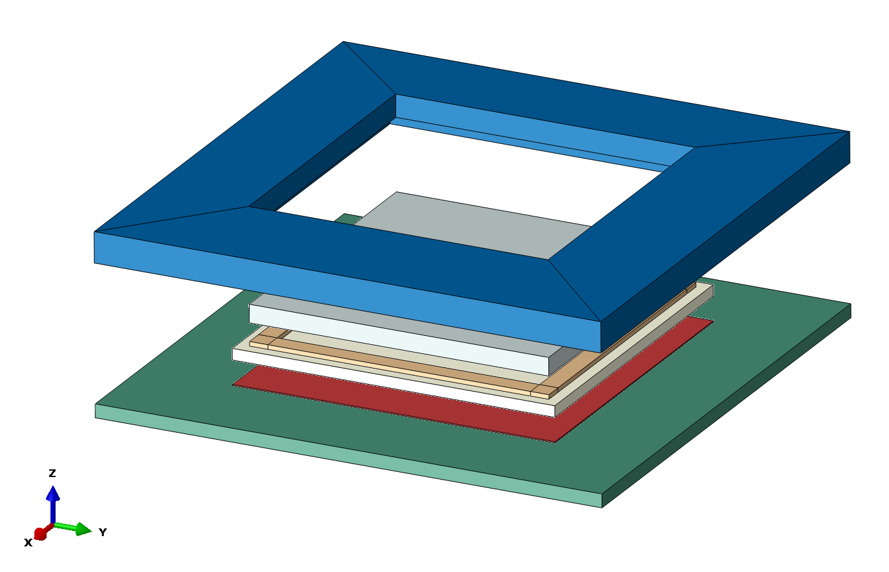
The FEA simulations were conducted using ABAQUS. The computer-aided design (CAD) was created based on the specification provided by the test vehicle assembly. A python-based script was developed to streamline and automate the CAD process. By doing so, it can save time for repetitive DOE studies, reduce manual errors in sketching geometry, and focus more on post-processing analysis. An example of the geometry created by using python-script is shown in Fig. 2. With the tie constraints, parts do not have to be merged into assembly. It allows different regions to bond together at interface even though meshes created on the surfaces of different regions may be dissimilar. Each part is meshed with its own size control for computational efficiency, and all is meshed using the second-order 20-noded brick element (C3D20R) for improved accuracy. An example of the mesh is shown in Fig. 3. The corner nodes are simply supported to remove the rigid body motion. A uniform thermal loading is applied to the entire package. The reference temperature is chosen at 150 °C for initial thermal condition. Material properties used in the FEA model are listed in Table 1. The encapsulant properties here in the table refer to baseline material (Encapsulant #1), additional encapsulant material (Encapsulant #2) is discussed in the Results section.

It should be noted that wire bonding plays a critical role in semiconductor packaging. Accurately meshing thin wires within the encapsulant is important but requires an extremely fine mesh due to small diameter and high count, leading to prohibitive computational cost and complexity. To address this, authors adopted a simplifying assumption that the wire bond volume fraction is relatively small compared to the overall encapsulant volume, and its effect on global warpage is minimal compared to dominant factors such as cure shrinkage and CTE-mismatch. Hence, wire bonds are excluded from current FEA models.
B. Cure shrinkage
Cure shrinkage is a volumetric contraction during the curing process, and it introduces significant internal stress, which can lead to substantial warpage when combined with stresses from CTE mismatch. To accurately model cure shrinkage, one needs to know how the degree of cure evolves over time and temperature. This is described by cure kinetics, which is usually determined from Differential Scanning Calorimetry (DSC) data. A commonly used model is the so-called Kamal model (Li et al. 2012), which directly relates the rate of cure to the current degree of cure and temperature as follows
dαdt=(k1+k2αm)(1−α)n
where is the degree of cure that goes from 0 to 1, and are temperature-dependent rate constants, and m and n are empirical exponents. Determining and for the Kamal model can be quite challenging, as it involves conducting isothermal DSC experiments, analyzing the heat flow data to obtain the rate and degree of cure, and then using regression to fit the Kamal model. Moreover, the accuracy of the determined constants heavily relies on the quality of the isothermal DSC data, which can be easily polluted by noise and improper temperature control. Given the complexities in Kamal model calibration, the volumetric strain method is a significantly simplified and practical approach to include cure shrinkage in FEA if the transient effect is not a concern.
In the volumetric strain method, a relationship between the volumetric strain and the degree of cure is assumed to exist, the simplest and most common assumption is a linear relationship, namely,
εvol=−αε0
where is the volumetric shrinkage strain as cure starts, and is the total volumetric shrinkage at full cure To measure the volumetric shrinkage, one would typically measure the density of the resin before and after curing, then calculate the volumetric shrinkage. A pycnometer is used to measure the density of the liquid resin, while a densometer or similar device is used to measure the density of the solid cured resin. The difference in density between the two states is then used to calculate the volumetric change, which is the cure shrinkage.
The relation for stress and strain with thermal effects is
σ=D(ε−αCTEΔT)
where is the stress tensor, and D is the material stiffness matrix, is the total strain, is the CTE with a subscript “CTE” added to distinguish it from the rate of cure, and is the change in temperature. Now, with additional cure-induced strain, the constitutive relation becomes
σ=D(ε−αCTEΔT−αε0)
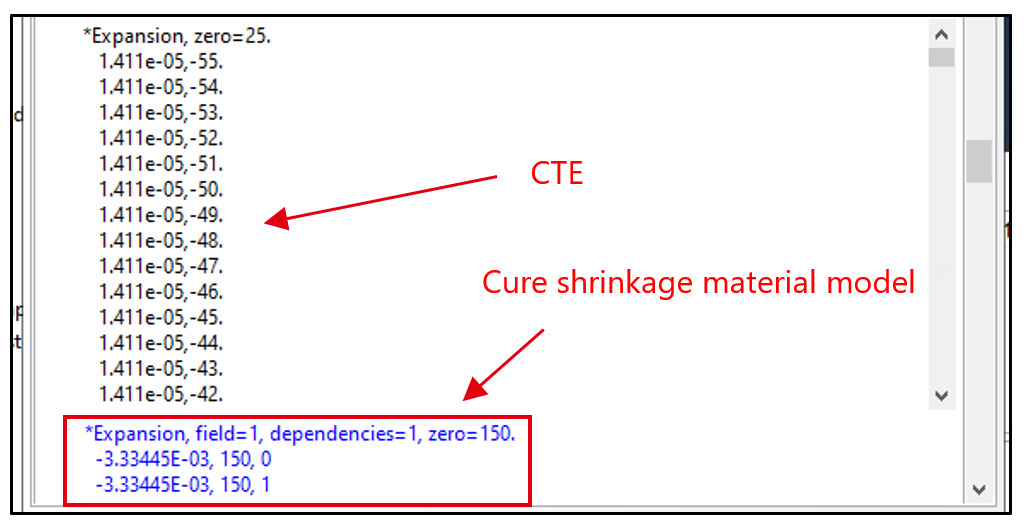
In FEA software, the cure-induced volumetric strain is often introduced through a user-defined material subroutine or a predefined material model. Here in this paper, we use a ‘predefined field variable’ to add the cure shrinkage strain. In ABAQUS, the field variables are used to represent spatially varying quantities like temperature or material properties. They are crucial for non-linear analysis and for simulating special scenarios. In this case, we are particularly interested in the volumetric contraction because of cure shrinkage. Field variables can be defined using a variety of methods, including specifying values directly, using analytical or discrete fields, or defining them in user subroutines. Unfortunately, the predefined field variables are not supported in ABAQUS CAE per user manual (ABAQUS User Manuel 2024). Hence, one must either add the field variable to the input files or edit the keyword in the model manually, as shown in Fig. 4. It is noted that the field variable here is defined as a linear expansion coefficient, hence one must convert the volumetric strain to an equivalent linear strain.
C. Viscoelasticity
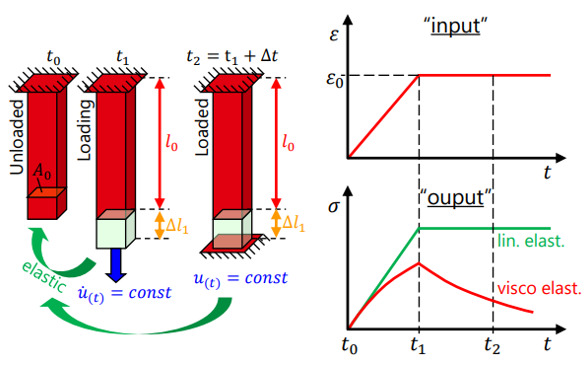
Unlike purely elastic materials that deform instantaneously under loading and return to undeformed shape upon unloading, viscoelastic materials display time-dependent deformation, e.g. stress relaxation, as illustrated in Fig. 5.

Viscoelastic behavior can be mathematically described using various models. A common and effective approach is the Prony series (Pacheco et al. 2015; Aslan and Akturk 2024; Williams et al. 1955), which represents the time-dependent relaxation modulus, as a sum of exponential terms:
G(t)=G0(1−∑Ni=1gi(1−e−tτi))
where is the instantaneous modulus, are the normalized relaxation moduli, and are the relaxation time in decay. Using the Fourier transform, the expression for the time-dependent shear modulus can be written in the frequency domain as follows:
G(ω)=Gs(ω)+iGl(ω)
where the storage modulus and the loss modulus are
Gs(ω)=G0[1−∑Ni=1gi]+G0∑Ni=1giτi2ω21+τi2ω2
Gl(ω)=G0∑Ni=1giτiω1+τi2ω2
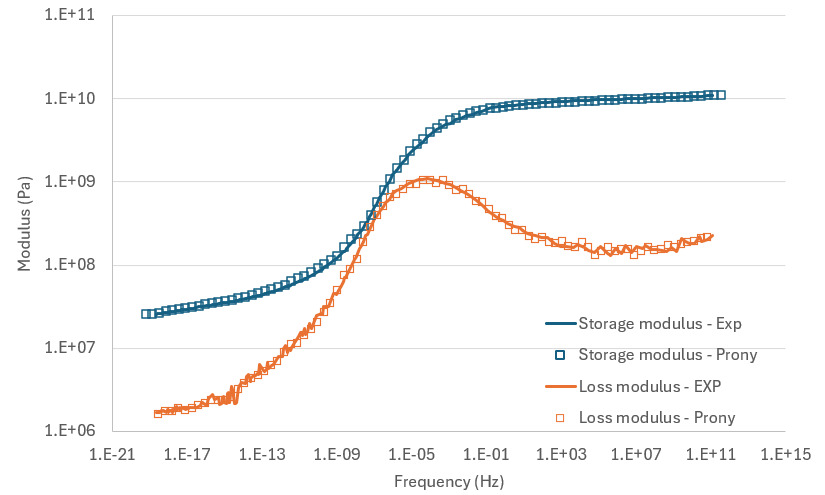
To use the Prony series in FEA simulations, the parameters need to be determined experimentally. This process typically involves performing a Dynamic Mechanical Analysis (DMA) test at relevant temperatures and frequencies and fitting the experimental data to the Prony series equation. The DMA test details are as follows. A temperature sweep is performed first to make sure all important temperatures and phase changes are captured. A small strain amplitude 0.1% is used to make sure material’s response is in the linear viscoelastic range. The frequency sweep is performed from 1 Hz to 25 Hz. The master curve is constructed by horizontally shifting the frequency sweep data at each temperature to align with the reference temperature at 25°C, using the Williams-Landel-Ferry (WLF) model. This approach ensures that the viscoelastic behavior across a wide range of timescales is accurately captured and reflects the material’s response. The fitting can be done using software or optimization algorithms to determine the best fit values for the Prony parameters. Fig. 6 shows the viscoelastic characterization for encapsulant material. Some noise can indeed be observed in the experimental loss modulus curve; however, the storage modulus curve appears smoother because, during the construction of the master curve, more weight was given to smoothing the storage modulus than the loss modulus. This is a common approach in DMA data processing, where data from different frequencies are shifted to create a continuous curve based on time-temperature superposition. It is challenging to achieve perfectly smooth curves for both storage and loss modulus simultaneously. The accuracy of the viscoelastic model depends on the quality of the experimental data and the number of Prony terms used. More terms generally provide a better fit but increase the complexity of the model. A careful selection of the number of Prony pairs is important to ensure an optimal balance to avoid both overfitting and underfitting.

D. Test vehicle assembly
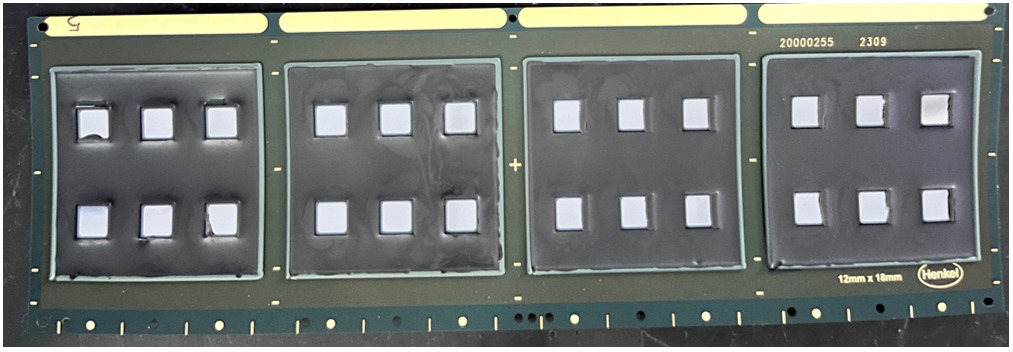
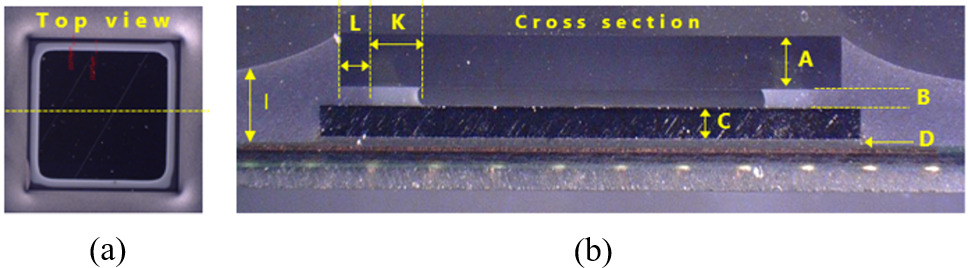
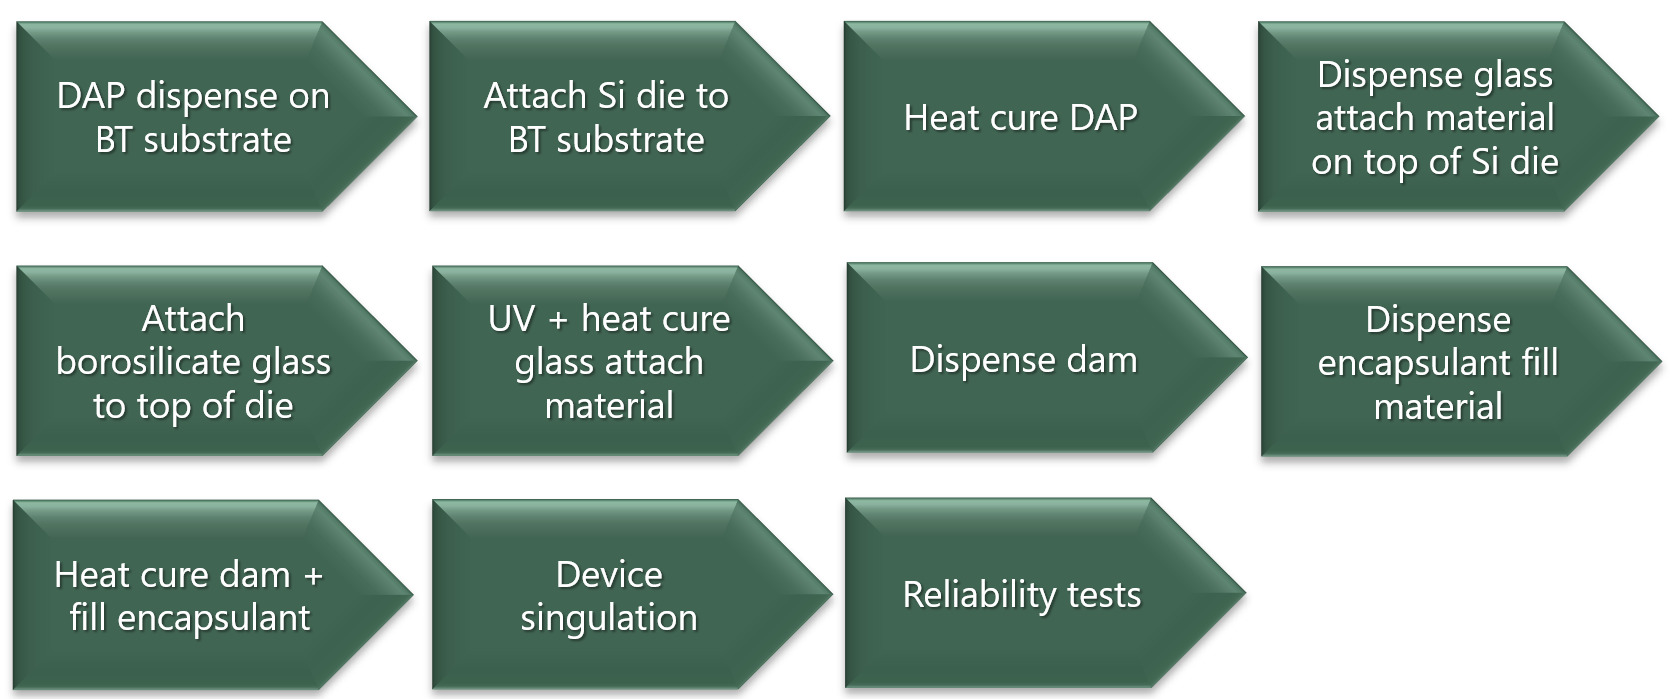
A test vehicle was designed to replicate the essential structural elements of an actual image sensor package, allowing for experimental testing of the mechanical behavior, as well as to validate the FEA simulation. Fig. 7 shows the test vehicle before singulation, where multiple image sensor packages are built onto one substrate for efficiency. Fig. 8 shows the singular image sensor package after singulation from different views. The assembly process illustrated in Fig. 9 comprises the key steps in die attachment, glass attachment, encapsulation, and singulation. Optional steps such as reflow, or post solder ball attachment are not included here. Dimensions of the test vehicle are in Table 2. Dimensions such as die size and encapsulant thickness can directly affect the stress distribution, warpage and reliability performance. Hence, dimensions are chosen carefully in the test vehicle design to ensure representative and normal package behavior. Current work focuses on the 7x7mm die size only. Study on die size variations is beyond the scope of current work. Materials and processes are selected to match those used in the actual image sensor package design.

_top_view_and_(b)_cross-section_view._dimensions.png)
III. Results and discussion
This section presents the findings from the FEA simulations and compares them with experimental results to validate the accuracy of the proposed methodology. The impact of incorporating cure shrinkage into the simulation using the volumetric strain method is evaluated, followed by a comprehensive DOE study to assess the influence of encapsulant material properties on package warpage and stress.
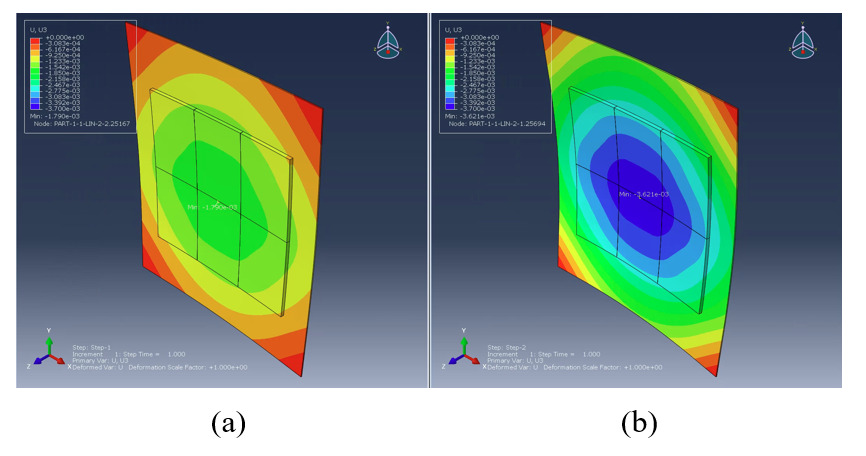
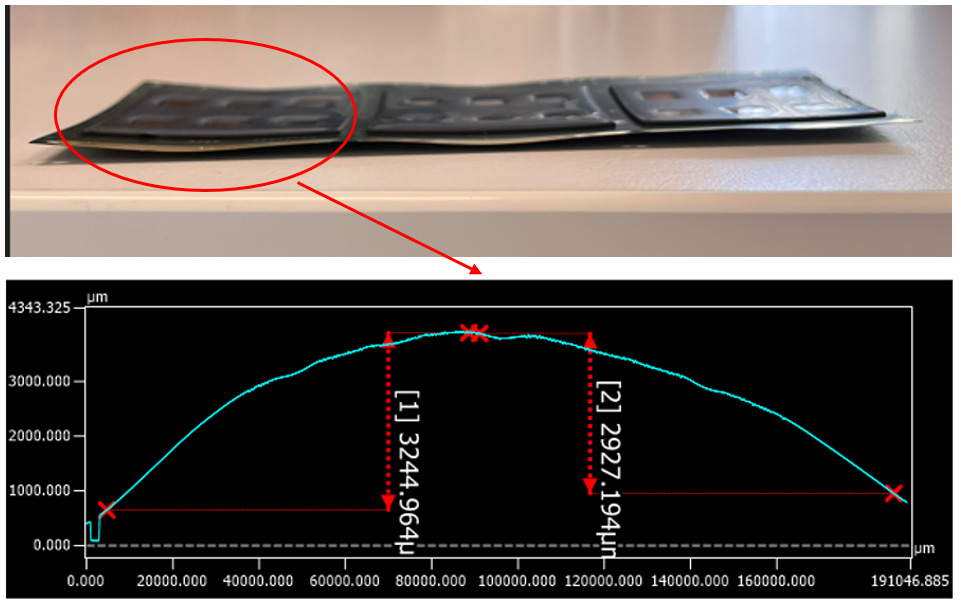
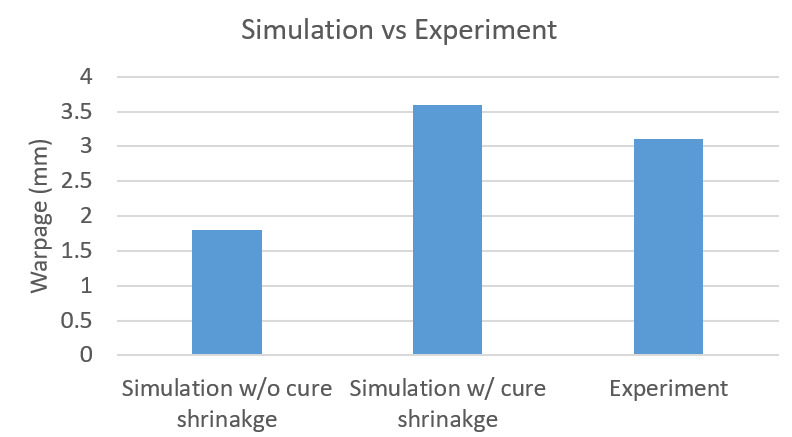
The simulations in this work rely on assumptions about the cure shrinkage. Hence, experiment validation is necessary and crucial to assess accuracy and increase confidence in simulation results, allowing this FEA model to be used reliably for predicting package performance. We performed simulations for both single package and panel configuration and compared the panel simulation results with experimental measurements. Figure 10 shows the warpage predictions with and without considering cure shrinkage in panel-level simulation. This is to ensure consistency with the experimental setup. Including viscoelastic properties does not affect the warpage magnitude significantly but reveals the warpage relaxation over time. For simplicity, only the elastic properties are included in the simulation for cure shrinkage in this paper. The simulation with viscoelastic effect and its impact on glass stress is discussed in the next section. It is seen that warpage prediction is much higher with cure shrinkage than without. Warpage measurements are obtained from the test vehicle using the Keyence 3D optical imaging to validate the simulation results in Fig. 11. Experiments and simulation results are compared at room temperature in Fig. 12. Error reduces from 42% to 16%, showing that the warpage prediction is much closer to the experiment with cure shrinkage effect included. This finding agrees with previous studies that excluding cure shrinkage in FEA simulations leads to significant inaccuracies (Hu et al. 2009), and in some cases, even shift in the zero-warpage temperature (Zhu et al. 2007). This reinforces the importance of incorporating cure shrinkage in warpage prediction models. What separates our work from existing approaches is that our prosed method is much easier to implement in standard FEA tools while still capturing most discrepancies between simulation and experiment. This makes it highly practical for industrial applications where modeling complexity and computational cost are critical considerations.
_without_cure_shrinkage_and_(b)_with_cure_shrin.png)


The remaining 16% gap can be attributed to several simplifying assumptions in the current model. The first is neglecting the time and temperature dependency of the cure reaction. The proposed method assumes a simplified cure shrinkage behavior without modeling the detailed kinetics of curing, which can influence warpage development during the process. The second is constant material stiffness during curing. Modulus evolves as a function of the degree of cure. Our simulation assumes the material is fully cured prior to thermal-mechanical analysis, which introduces some deviation from actual behavior.
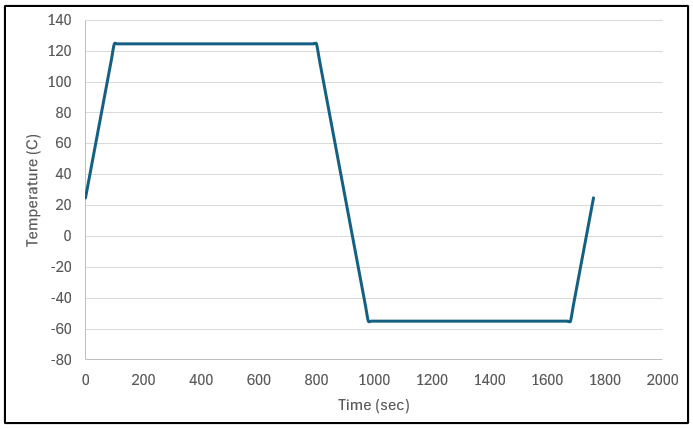
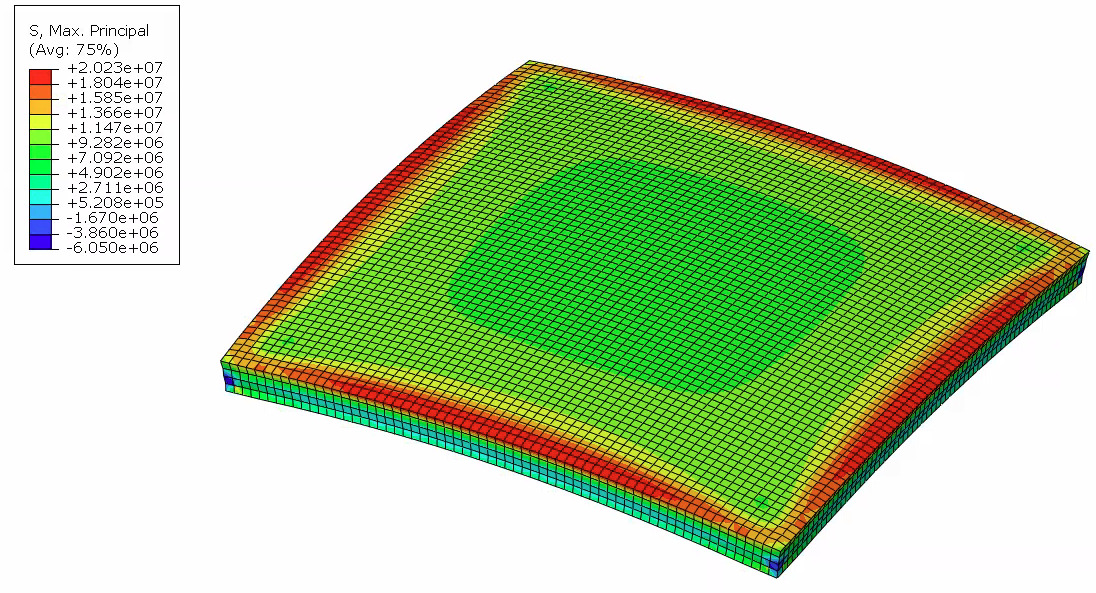
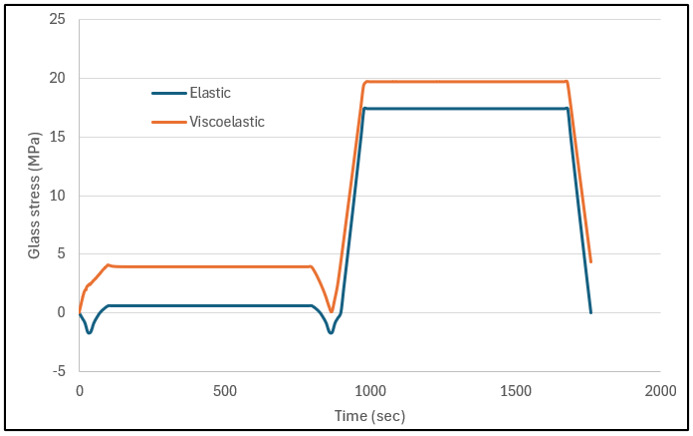
Encapsulant materials used in image sensor packaging exhibit viscoelastic behavior. Accurate modeling of viscoelasticity in encapsulant is crucial for accurate warpage and stress prediction over time. Fig. 13 shows the temperature profile of a thermal cycle test. One cycle of the thermal cycle test is simulated here to evaluate the time-dependent effect. Fig.14 shows stress concentration at the glass edge. Glass cracking is a critical failure in image sensor packages. Stress concentration, often exacerbated by CTE mismatch between encapsulant and the glass, can lead to cracks, compromising optical performance and device integrity. Fig.15 shows the influence of encapsulant’s viscoelasticity on glass stress. Using viscoelastic model predicts slightly higher stress than using elastic model, so it presents a higher risk for glass crack. Furthermore, there is residual stress in glass at the end of the cycle. This is due to the viscous effect of encapsulant’s viscoelasticity, which leads to a delayed response and a retention of stress on encapsulant even after deformation stops. The residual stress on glass will carry over to the next cycle and build up significant stress eventually leading to failure. Contrarily, elastic solutions do not capture residual stress, resulting in inaccurate predictions. Therefore, viscoelastic modeling of encapsulant is necessary to predict time-dependent deformation, and critical to achieve a more accurate simulation result, especially in capturing the influence of encapsulant on glass crack.


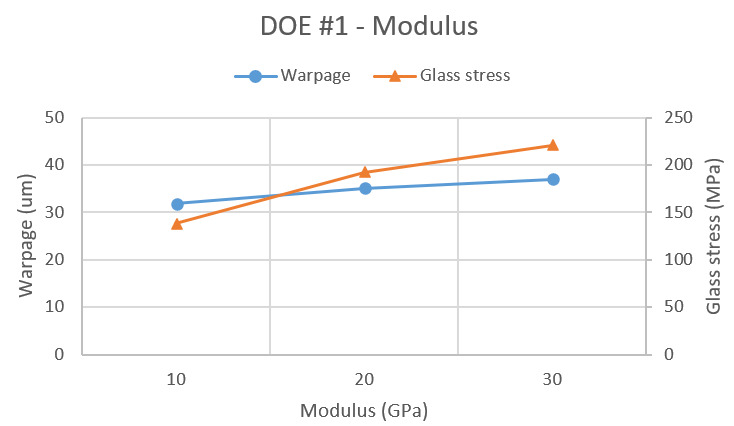
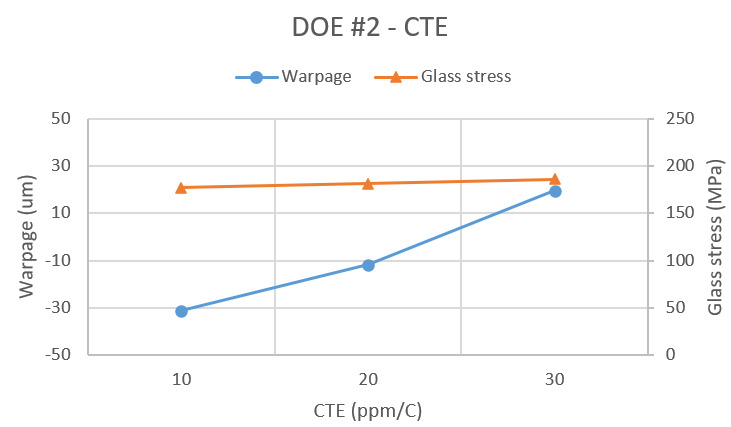
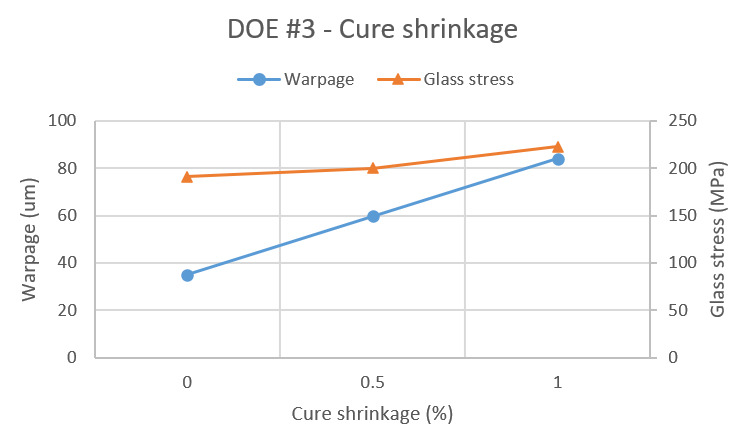
DOE studies are essential to systematically investigate how encapsulant material properties influence package reliability, particularly concerning glass cracking. It is noted that simulation here in DOE studies is done on single package for computational efficiency in contrast to the panel package for experiment validation. Fig. 16 shows the DOE study on modulus. Encapsulant with higher modulus causes higher stress on glass, which increases the risk of glass crack. But warpage is not significantly affected by modulus. Fig. 17 shows the DOE study on CTE. Encapsulant with higher CTE causes significantly higher warpage, but only minor increase on glass stress. It is worth mentioning that the warpage shape is flipped from one side to the other as CTE increases. The “negative” warpage means it is bending towards the substrate side, which is opposite direction of the baseline in Fig. 10. This shows that a lower CTE for the encapsulant is not always optimal. Instead, there exists a specific CTE value that minimizes the mismatch with other components, thereby reducing warpage. Fig. 18 shows the DOE study on cure shrinkage. Trend is like that of CTE. Encapsulant with higher cure shrinkage can cause both more warpage and more glass stress.


The DOE studies on the impact of modulus and CTE aligns with findings reported in Jia et al. (2019), but our work extends this by systematically analyzing the combined effect of cure shrinkage and material properties on both warpage and glass stress. This integrated approach is new and provides deeper insight into how these factors interact, which have not been addressed in prior studies.
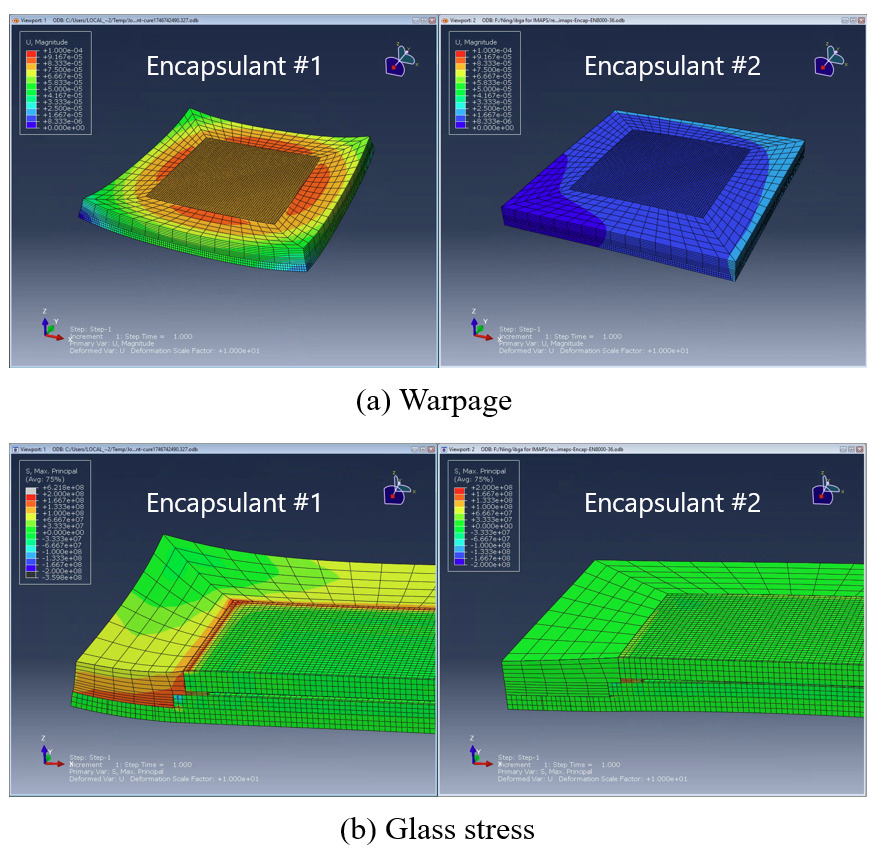
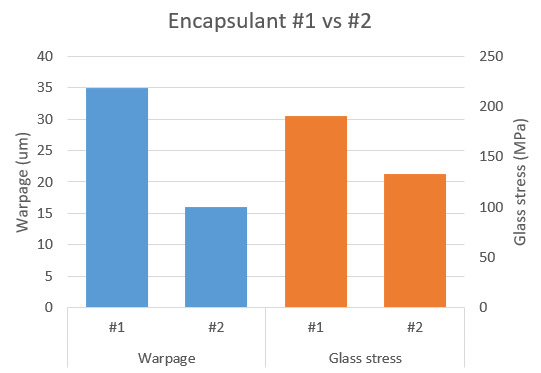
Based on the insights gained from the DOE studies, a new encapsulant material (Encapsulant #2) with optimized properties was designed from baseline (Encapsulant #1). Simulations using this new candidate encapsulant predict a significant reduction in both package warpage and glass stress, as in Fig. 19 and Fig. 20. This demonstrates the effectiveness of the DOE-driven approach in optimizing encapsulant properties and ultimately enhancing the reliability performance of the image sensor packages. The next step involves collaborating with material scientists to fine-tune the formulation of this new encapsulant candidate, followed by experimental verification of its performance.
_and_new_material_(encapsulant__2)_in_ter.png)
IV. Conclusion
This paper addresses the critical issue of package warpage in image sensors, which can significantly degrade optical performance and long-term reliability. The work highlights the importance of accurately modeling the cure shrinkage effect and the viscoelastic behavior of encapsulant materials, which are often neglected in traditional simulation studies. The proposed FEA method, incorporating cure shrinkage, demonstrates a significant improvement in accuracy of warpage prediction compared to simulations that do not account for this phenomenon. Accurate modeling of viscoelasticity is also crucial for capturing the residual glass stress caused by the viscous effect, a phenomenon that elastic solutions cannot predict. Furthermore, the comprehensive DOE study provides valuable insights into the influence of encapsulant material properties, including modulus, CTE, and cure shrinkage on package warpage and glass stress. These findings contribute to a better understanding of the factors governing image sensor package reliability and provide a foundation for optimizing material selection and package design.
It should be noted that current experimental validation is based on one test vehicle, future work will diversify the design configuration and include additional measurements to strength statistical confidence.