
I. Introduction
In microelectronic packaging, soldering is the traditional method for forming electrical, mechanical, and thermal interconnects between dies and substrates. Soldering can be highly parallelized, making it scalable and cost-efficient. It has short processing times and high electrical and thermal conductivity. However, the advent of wide-bandgap semiconductors (e.g. SiC and GaN) has led to the expectation that junction temperatures will exceed 200 °C (Rogers Corporation Blog, n.d.). This requires improved thermal management of packages, which traditional solder materials cannot fully provide due to the following reasons. Traditional solders have melting temperatures below 250 °C, while a significant decrease in mechanical stability and reliability is already observed at 200°C (Rogers Corporation Blog, n.d.). In contrast, sinter connections have melting temperatures of up to 961 °C, maintaining their structural integrity significantly longer, eliminating the risk of remelting during board-level soldering (Kraft et al. 2013). Moreover, solder connections exhibit lower thermal conductivity compared to sinter connections creating a thermal bottleneck limiting heat dissipation (Yong 2014). Consequently, the industry is shifting toward sinter connections, addressing some of solder connections shortcomings while providing an electrical resistivity comparable to solders (Yong 2014). While significant research exists on pressure-assisted sintering of large-area components, such as dies, coolers, and heat sinks, limited research has been conducted on low-temperature, pressureless sintering 200 °C) for small optoelectronic components (Zhang and Suganuma 2019; Rábay and Stelzer, n.d.). Achieving this requires overcoming new challenges in material research and application technologies. For example, this study moves from conventional printing and needle dispensing processes to material dosing using non-contact jet dispensing for higher-viscosity pastes. In this context, non-contact is strictly defined by the droplet transfer mechanism. Unlike needle dispensing which relies on a constant fluid bridge between needle-tip and substrate – necessitating precise z-axis control to prevent collision with the substrate – jet dispensing ejects a single droplet which travels the gap ballistically. This allows for significantly larger working distances, minimizing the risk of substrate collision, while simultaneously preventing a fluid bridge between substrate and dispenser eliminating the risk of material contamination. Furthermore, jetting significantly enhances throughput by allowing continuous fixed-height motion and achieves the high-resolution deposition essential for micro-optoelectronic assembly. Various studies have addressed the challenges of paste dosing, typically dealing with the dosing of solder pastes and their rheological behavior (Becker et al., n.d.; Pietrikova and Kravcik 2012; Mallik et al. 2008), as well as, more recently, the dosing of liquid metal (Maslik et al. 2024). Herein, we utilized a volumetric flow model as a qualitative framework to decouple parameter dependences, enabling an experimental methodology for the precise control of dot volume and shape using contactless jet dispensing. Furthermore, we evaluate the performance and reliability of a newly developed, low-temperature, pressure less Ag sintering paste that, unlike typical sintering pastes, is suitable for jet dispensing.
II. Modelling
A. Material:Silver-Sintering Paste
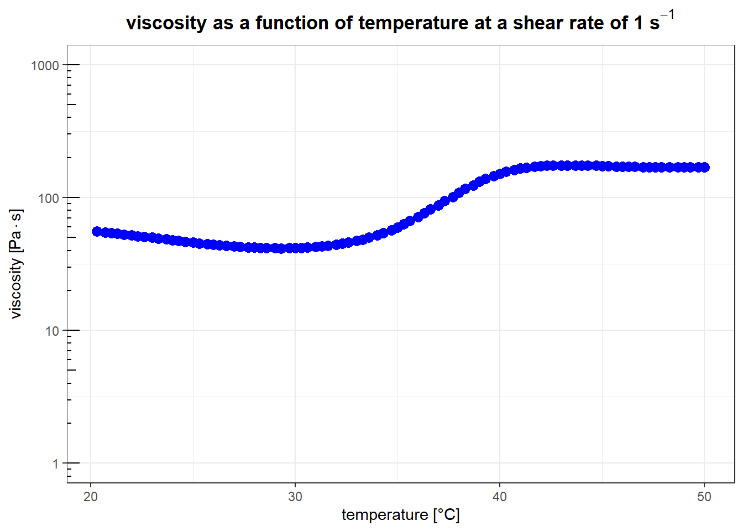
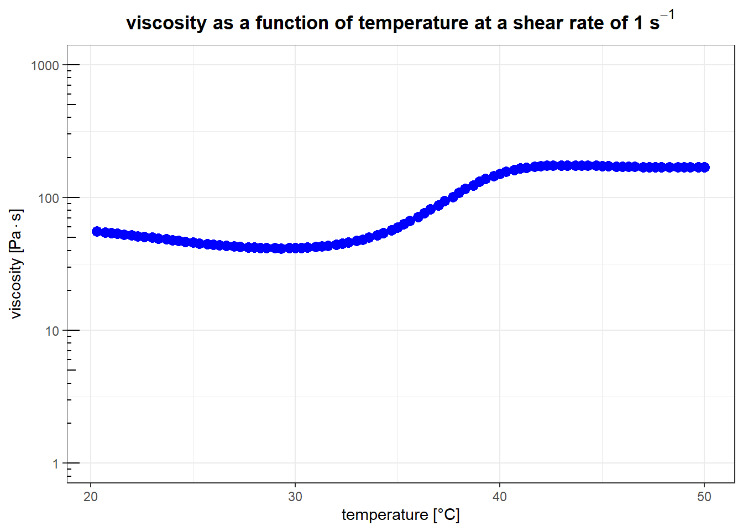
The silver sintering paste used in this study was provided by Nano-Join GmbH, a German manufacturer of sintering pastes located in Berlin. This material is under development and aims to achieve reliable sinter interconnects in a pressure-less sintering process while ensuring fine dispensability. The paste system, which is stable at room temperature, has been redesigned entirely for the intended application. It contains special silver microparticles measuring less than 10 µm, combined with silver metal organics and an innovative binder system. This allows for the formation of dense, void-free, and reliable sintered interconnects. To achieve the desired pressureless process with reproducible parameters, we chose to use a convection oven with a significantly reduced sintering temperature of 200°C in air or nitrogen. This low peak temperature favors many optoelectronic components and meets the industry’s demand for lower process temperatures (Zhang et al. 2016). Crucially, this approach offers distinct advantages over semi-sintering adhesives processed under similar conditions (Yao et al. 2018). Semi-sintering adhesives typically address porosity – a reliability issue in traditional sintering-connections – by infiltrating the silver network with an organic resin (Zhao et al. 2023). While this reduces porosity the retained polymer matrix creates critical limitations. The insulating resin limits the effective thermal- and electrical-conductivity compared to a pure metal interface (Liang et al. 2025). Furthermore, the organic matrix undergoes thermomechanical softening at elevated temperatures compromising the joint’s shear strength in high-power applications (Liang et al. 2025). In addition, the large difference in the coefficient of thermal expansion between the resin and sintered silver, leads to the formation of cracks in the interconnect in high temperature environments (Liang et al. 2025). In contrast, the paste employed in this work resolves the porosity-reliability trade-off without utilizing permanent resins, preserving the superior conductivity characteristic of a pure metallic interconnect. To better understand the paste’s behavior during jetting and to find the ideal processing conditions, we characterized the paste rheologically, as shown in Figure 1. The analysis shows a slight decrease in viscosity up to 30 °C; then, it slowly increases, possibly due to the evaporation of volatile components. This limits the upper bound of the processing temperature during jetting to 30 °C. Additionally, the ductile Ag particles increase the risk of interlocking and agglomeration, which can lead to nozzle clogging during jetting due to high forces and shear rates. To overcome these challenges, the equipment and process parameters must be adjusted to achieve stable, reliable jet dispensing.
B. Process: Jet-dispensing
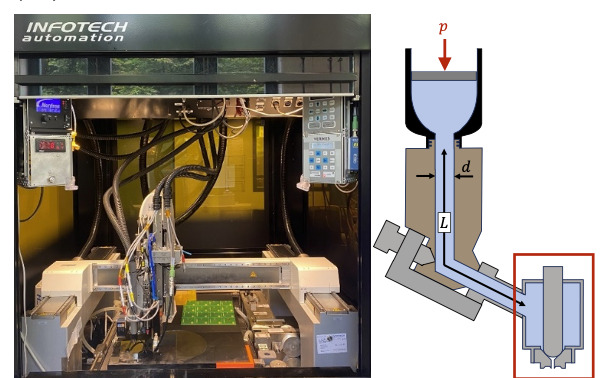
In this work jet-dispensing is done using a Vermes MDV 5100-NB piezoelectric jetting valve mounted on an Infotech FC1200 manufacturing cell as shown in Figure 2 (left).
__schematic_sketch_of_fluidic_.png)
Figure 2 (right) shows the jetting valve, which consists of the valve itself and a fluidic module that houses the tappet and nozzle. The fluidic module conveys the paste-like material from the pressurized cartridge to the nozzle chamber, which contains the nozzle and tappet. Nozzles and tappets are available in various shapes and sizes, each designed for dispensing different materials. For this study, we used an N11 250 nozzle (a 90° tapered carbide cone with a 250 µm opening) paired with a TTF-15 tappet (a cylindrical tappet with a 1.5 mm spherical carbide tip) in Section III, and an N64 120 nozzle (a 60° tapered carbide cone with a 120 µm opening) paired with an SNTF-6 tappet (a cylindrical tappet with a 600 µm spherical ceramic tip) in Section IV. The nozzle size was selected to be as small as possible to dispense the smallest droplets while being large enough to prevent clogging, maintaining a nozzle-to-particle size ratio of >10:1 (120 µm orifice vs. 10 µm top cut of silver particles). This safely exceeds the standard industry guideline of 7:1 required to prevent clogging in particle filled fluid dispensing (Ashley and Adamson 2008). The tappet was chosen to be compatible with the nozzle and as small as possible to jet-dispense the smallest droplets. All hardware configurations are summarized again in Table 1.
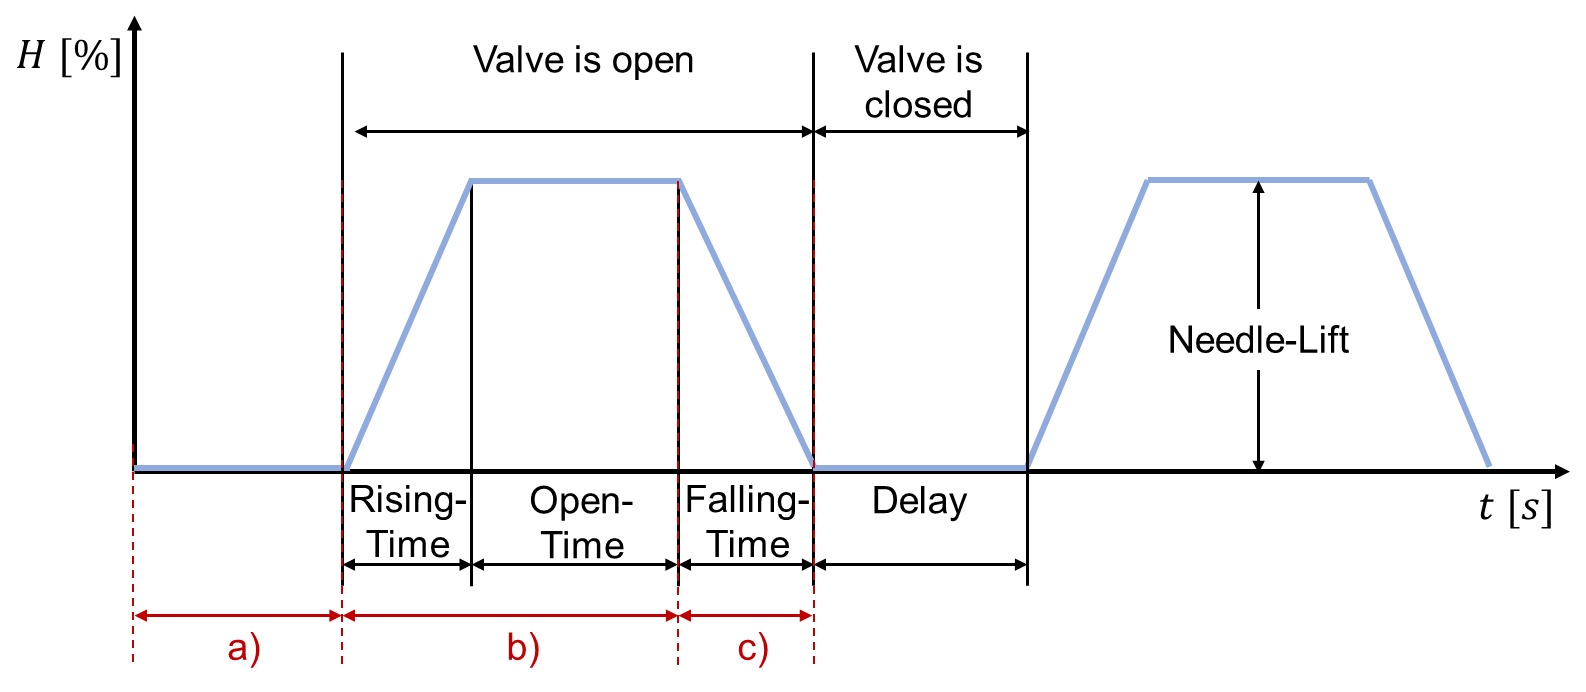
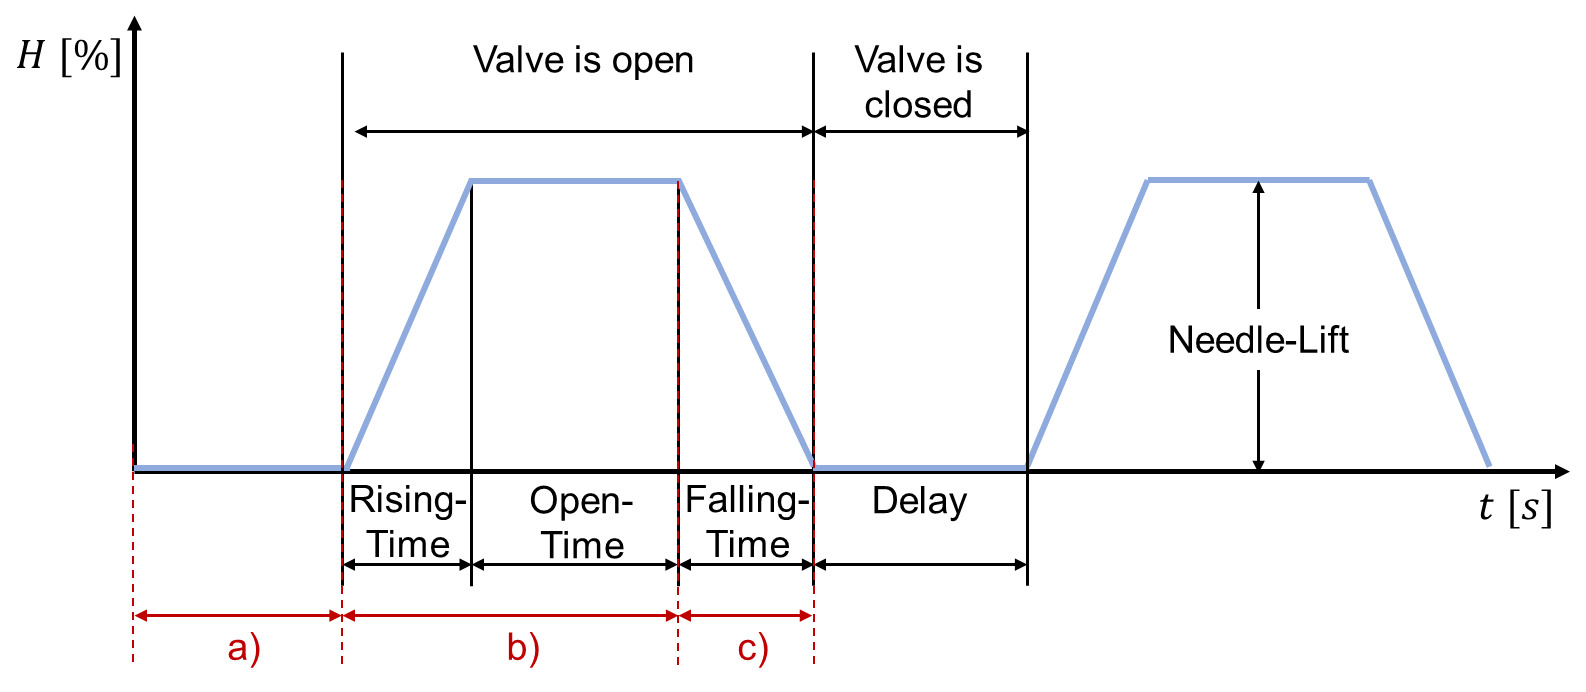
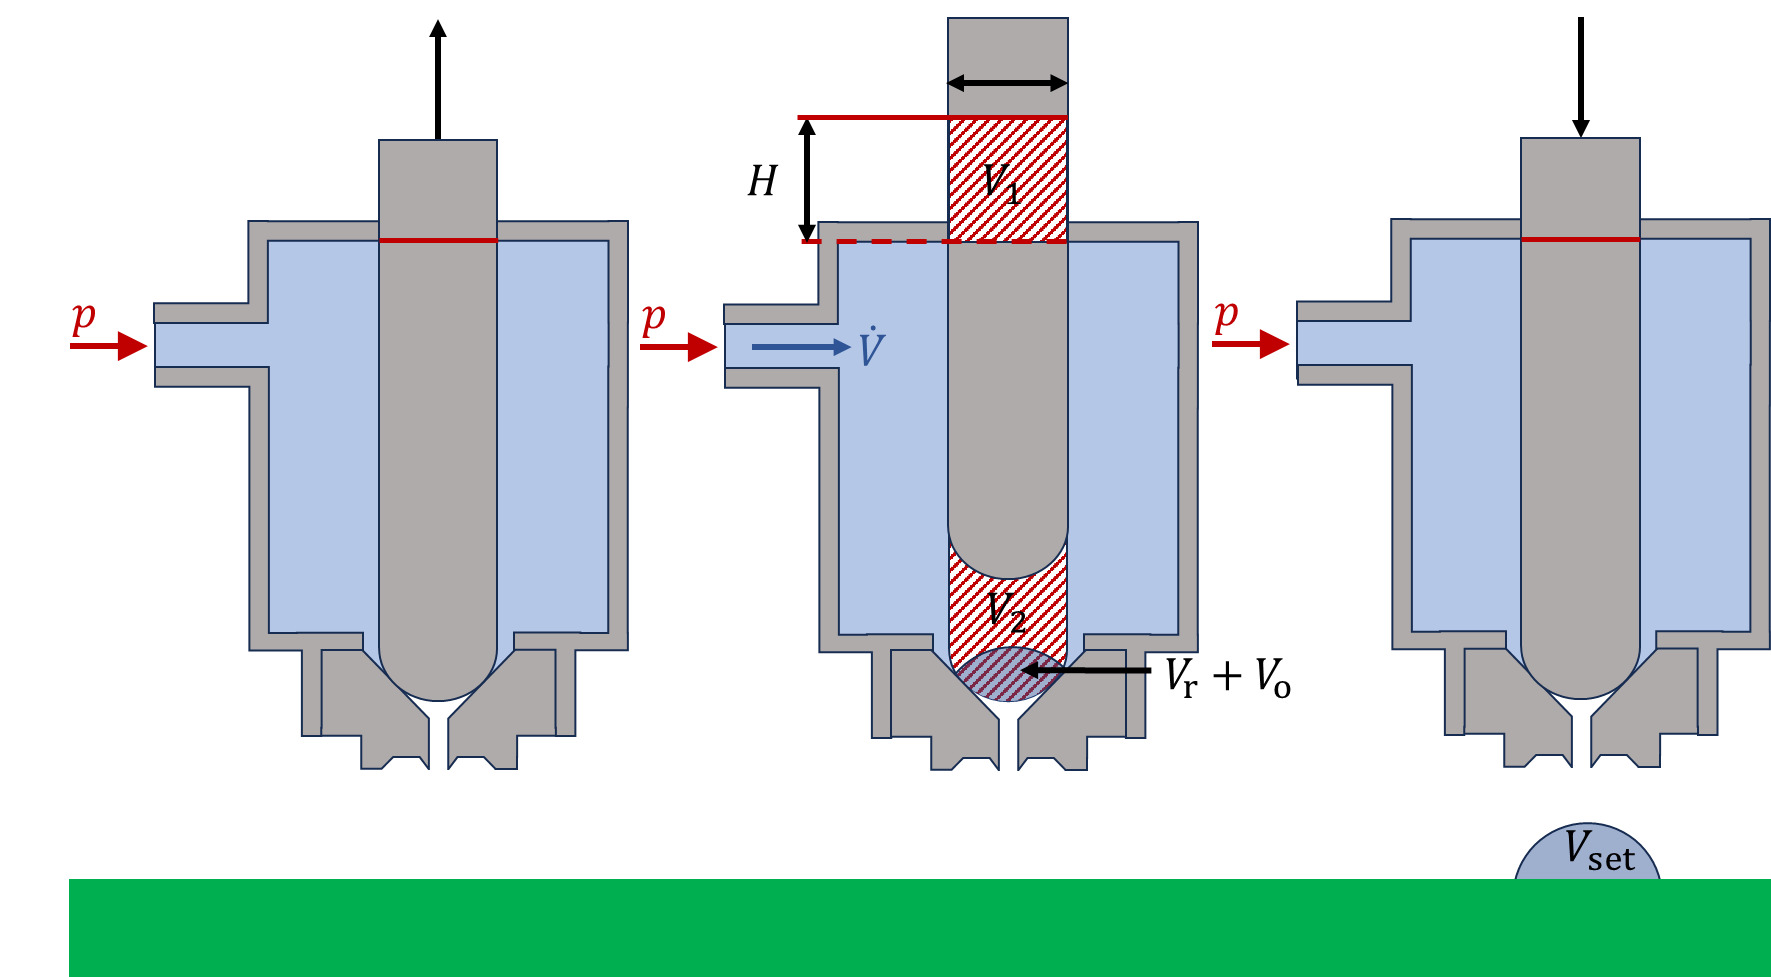
The jet-dispensing process is primarily characterized by the tappet’s movement over time (see Figures 3 and 4), which is controlled by a piezoelectric drive. The process can be divided into three main stages. In stage A, the tappet is not displaced, sealing the nozzle outlet (needle-lift In stage b), the tappet displaces by the set needle-lift value opening the nozzle. The time it takes to reach this value is called the rising-time In stage c), the tappet remains displaced for the open-time enabling material to flow into the nozzle chamber. Rising-time and open-time are key parameters that determine the dot volume because longer times allow more material to flow into the nozzle chamber. The other two parameters are cartridge pressure, which adjusts the volume flow, and needle lift. Cartridge pressure determines the pressure at the valve, which affects volume flow. Meanwhile, maximum needle lift strongly influences maximum dot volume. During the falling-time the tappet moves back down to its initial position, ejecting the sinter paste. Consequently, a shorter falling-time results in higher kinetic energy being applied to the material, thereby increasing the velocity of the ejected material. Controlling the amount of kinetic energy applied to materials with ductile fillers is crucial, as high kinetic energy increases the risk of particle agglomeration and nozzle clogging.
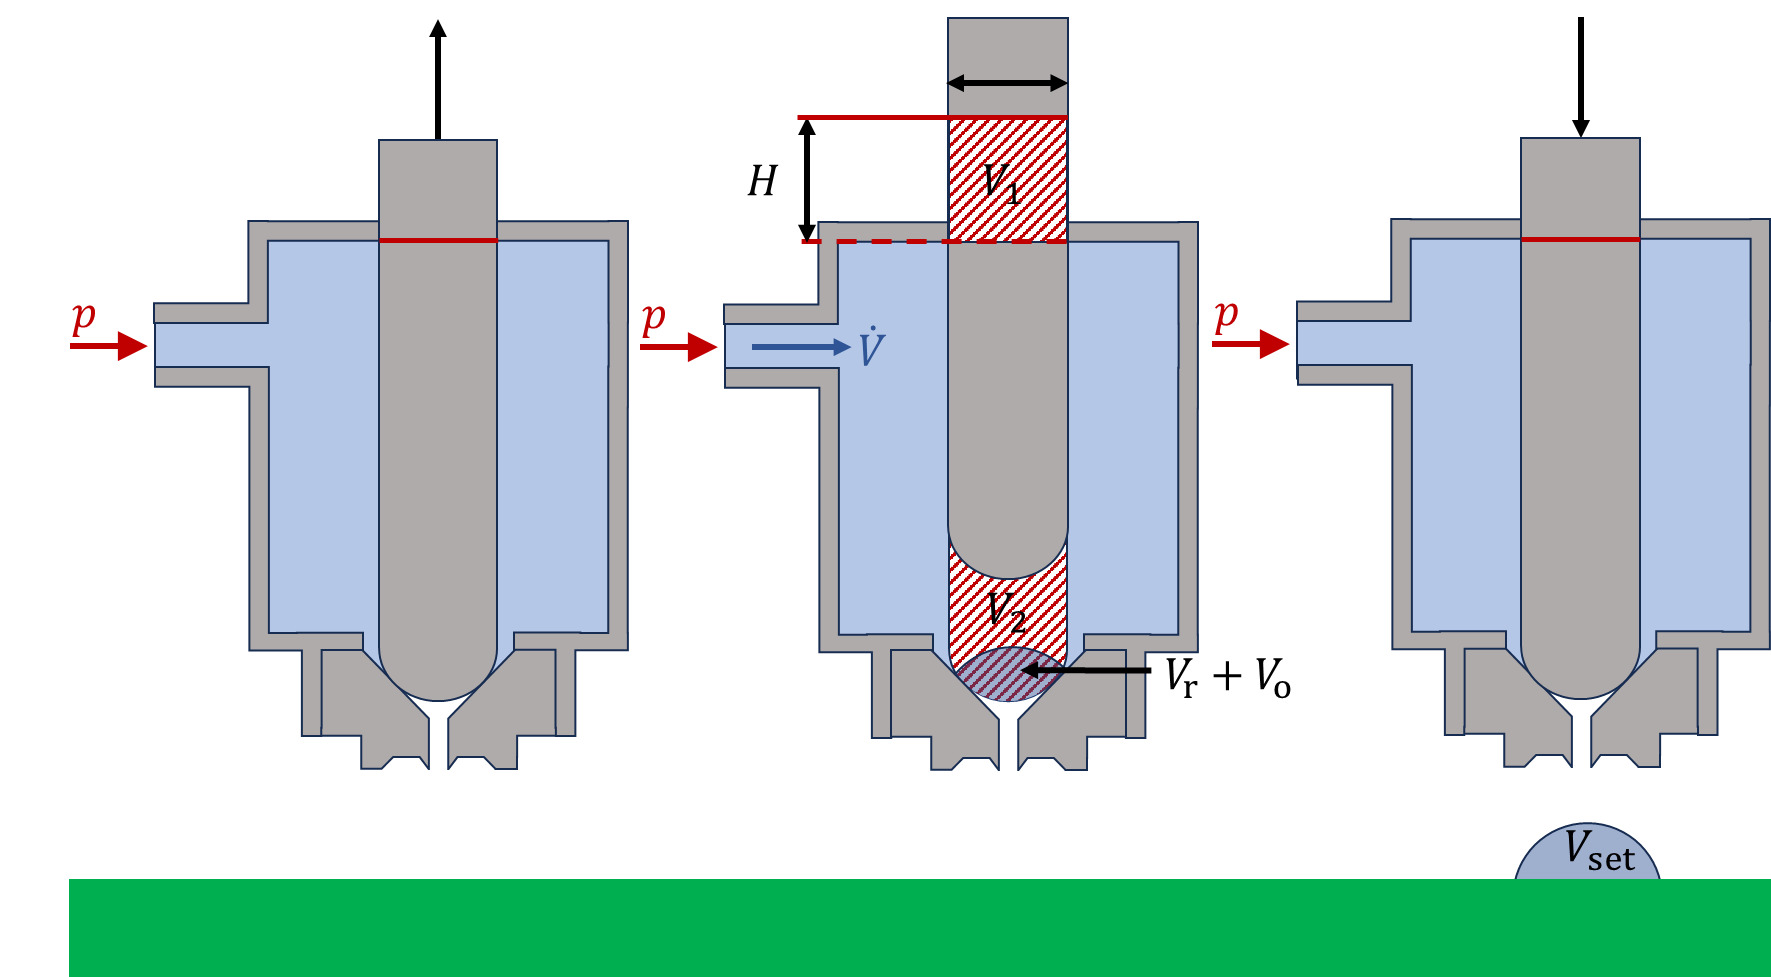
For a deeper understanding of the process and its parameters, we propose to model volumetric flow in the fluidic channel using the Hagen-Poiseuille-Equation (1). It is derived from the Navier-Stokes-Equations for stationary laminar flow of an incompressible Newtonian fluid in a constant diameter pipe, assuming no slip conditions at the boundary (i.e. inner surface of the modeled fluidic channel). Here, is the volumetric flow rate, is the pressure applied at the cartridge, is the material’s dynamic viscosity, the radius and the length of the fluidic channel.
˙V=π⋅r4⋅Δp8⋅η⋅L
It is important to note that (1) assumes a Newtonian fluid. However, the sintering paste demonstrates a complex rheological behavior. As shown in Figure 1 the viscosity is not constant – as assumed by the model – but highly sensitive to temperature, exhibiting an increase in viscosity above 30 °C. Furthermore, pastes containing a high amount of solids typically exhibit shear thinning, meaning the effective viscosity decreases during high-speed jetting impulses. Consequently, the analytical model cannot provide quantitative predictions. Instead, it serves as a qualitative framework to decouple the influence of machine parameters and guide the experimental setup.
To identify the governing parameters, we first define the volume released by the tappets displacement as (see Figure 4). This can be obtained using (2).
V=H⋅h⋅π⋅d400
Here (in %) is the needle-lift, is the maximum tappet travel distance and is the tappets diameter for TTF-15 and for the SNTF-6 tappet). The lower dot volume limit is set by the lowest configurable rising-time, as material flows into the nozzle-chamber once the tappet is displaced. This volume is given by (3).
Vr=˙V⋅tr
The volume to be filled during the open-time to eject is determined by (4).
Vo=Vset−Vr
Using this, it is possible to determine a relationship between open-time and the desired dot volume as shown in (5).
to=Vo˙V
This derivation demonstrates the correlation between different control parameters identifying open-time, needle-lift and pressure to be directly coupled to the dispensed volume. Conveniently, falling-time is identified as a theoretically free volume-neutral parameter, which will be used to adjust the diameter of the jetted depot. Therefore, our experimental approach in III does not rely on calculating via (5) due to the unknown shear viscosity. Instead, we employ a statistical iteration to find the correct set of parameters for a desired volume, utilizing the model as a guidance for designing the experiments and exploiting the independence of dispensed volume from falling-time.
III. Validation of process model
To validate the influence of the parameters outlined in Section II.B, we employed two experimental groups to develop an approach for determining the optimal parameter set for a given application. In this case, we optimized square-footprint LED dice with an edge length of 980 µm and a height of 190 µm. We determine the target volume and, based on that, calculate the target volume of the jetted depot because the volume of the sintering paste decreases by approximately 58% when sintered. According to common practice, the adhesive (in this case, sintering paste) should wet no more than two-thirds of the chip height. Using the formula for the volume of a frustum of a pyramid and subtracting the chip volume, we calculated a wet target volume of
A. Experimental Group 1 (EG1)
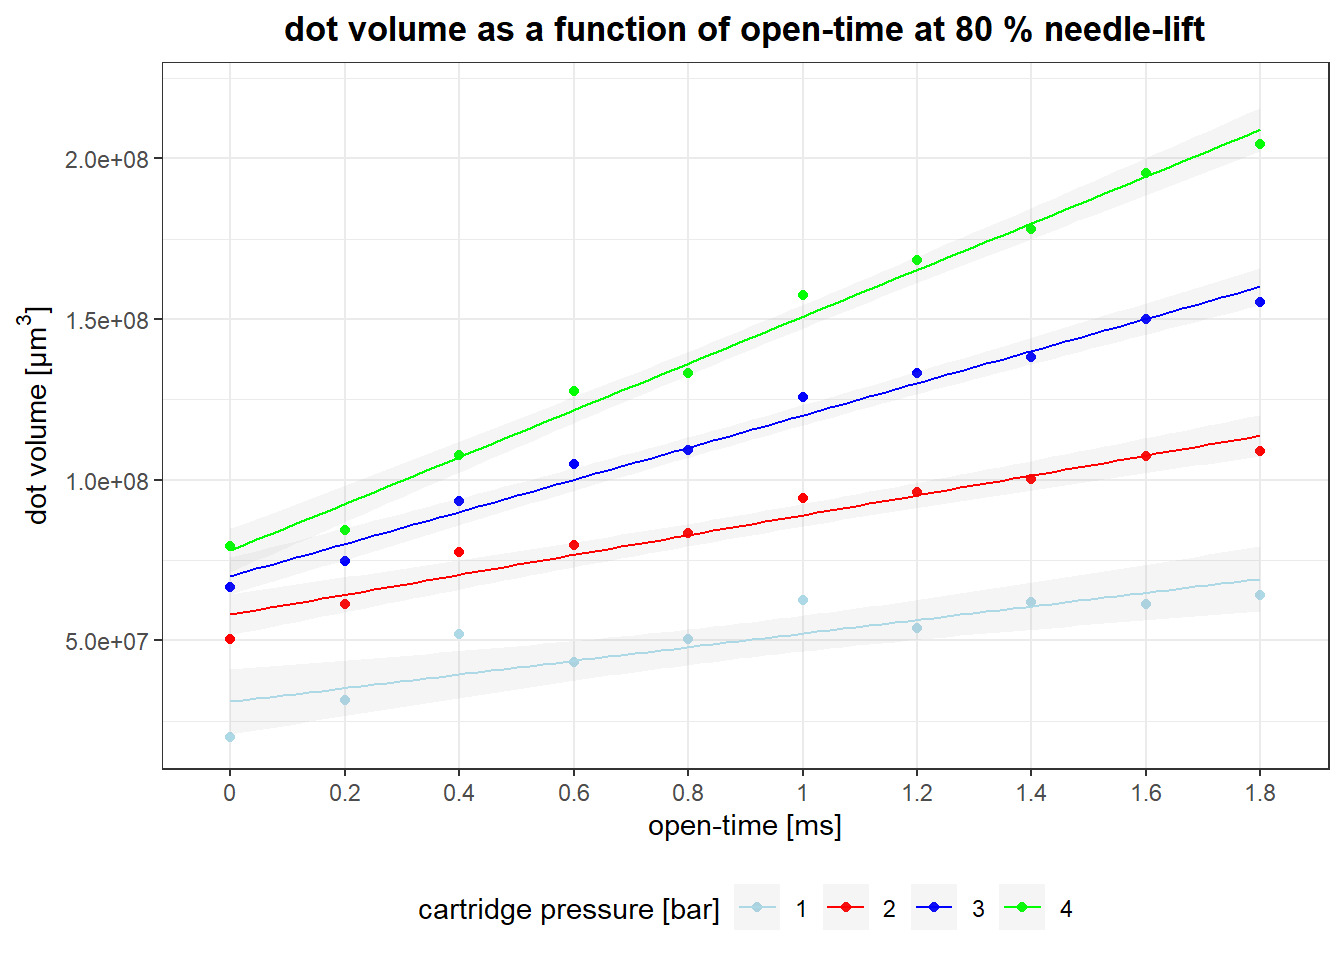
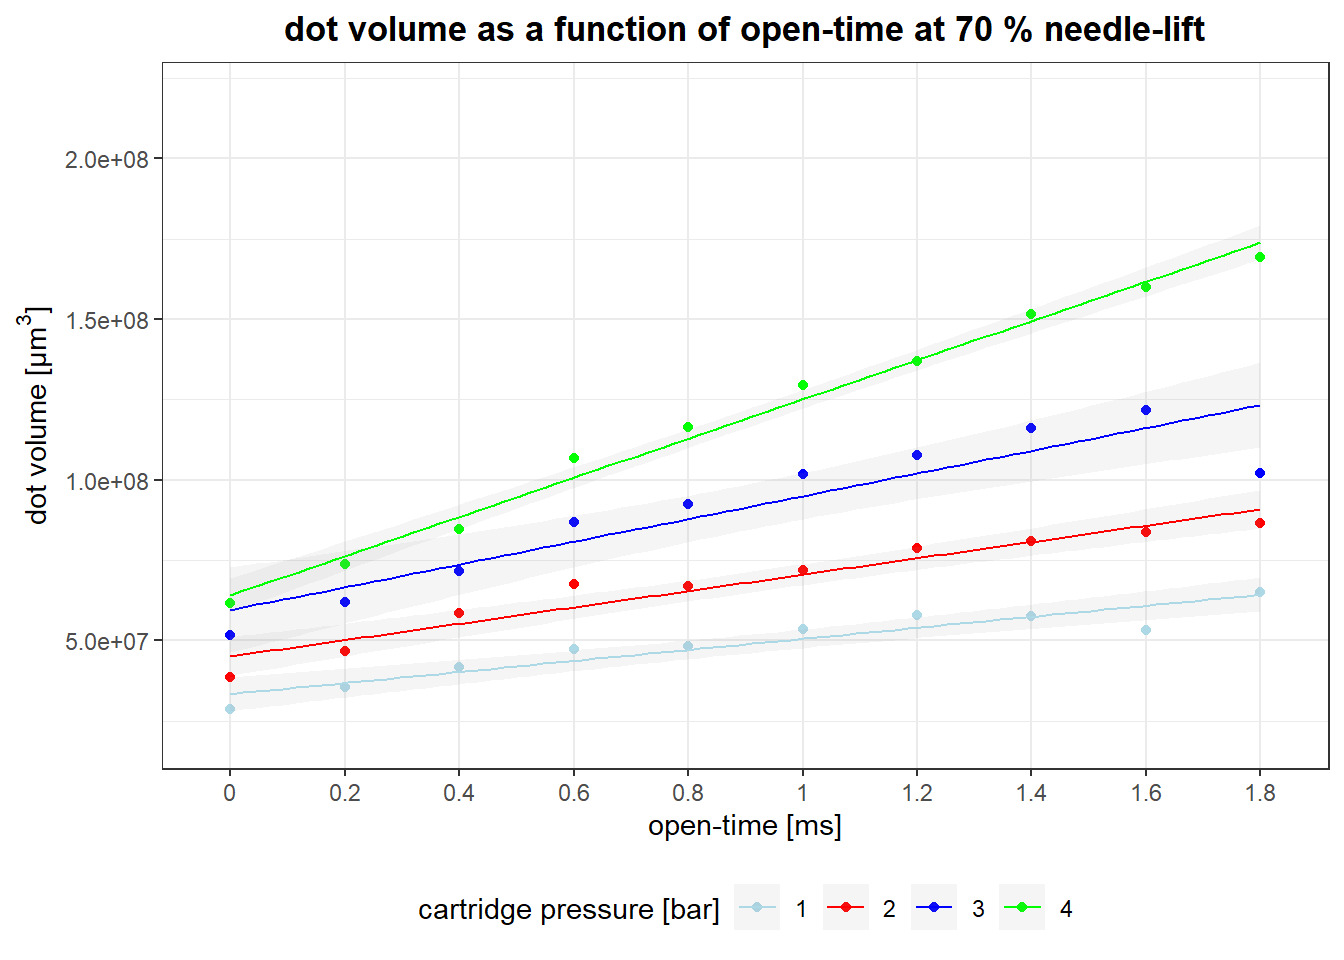
In the first group we measured the dot volume at various open-times and pressures with needle-lifts of and We obtained the dot volume values by jetting five sets of 100 dots each and measuring their weight for each data point. Using the material’s density, we calculated the mean dot volume of a single droplet. The results are shown in Figure 5 and Figure 6 For this experiment the rising-time is set to its lowest possible value, while the falling-time was adjusted to ensure no material residues were left under the nozzle. This resulted in the parameter sets shown in Table 2, resulting dot volume vs open-time for both needle lift setting is shown in Figure 5 and Figure 6.
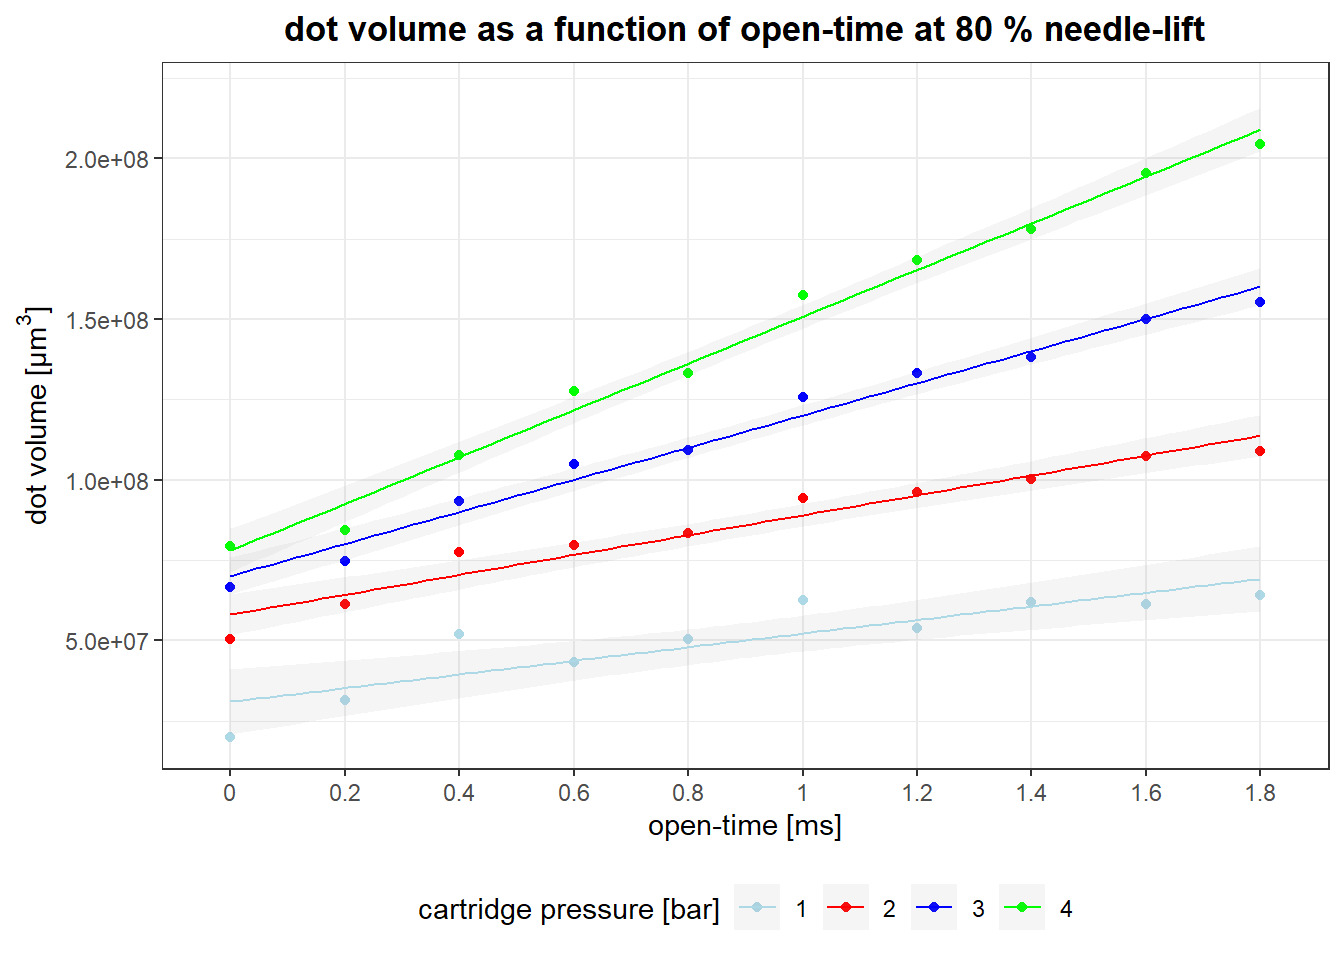
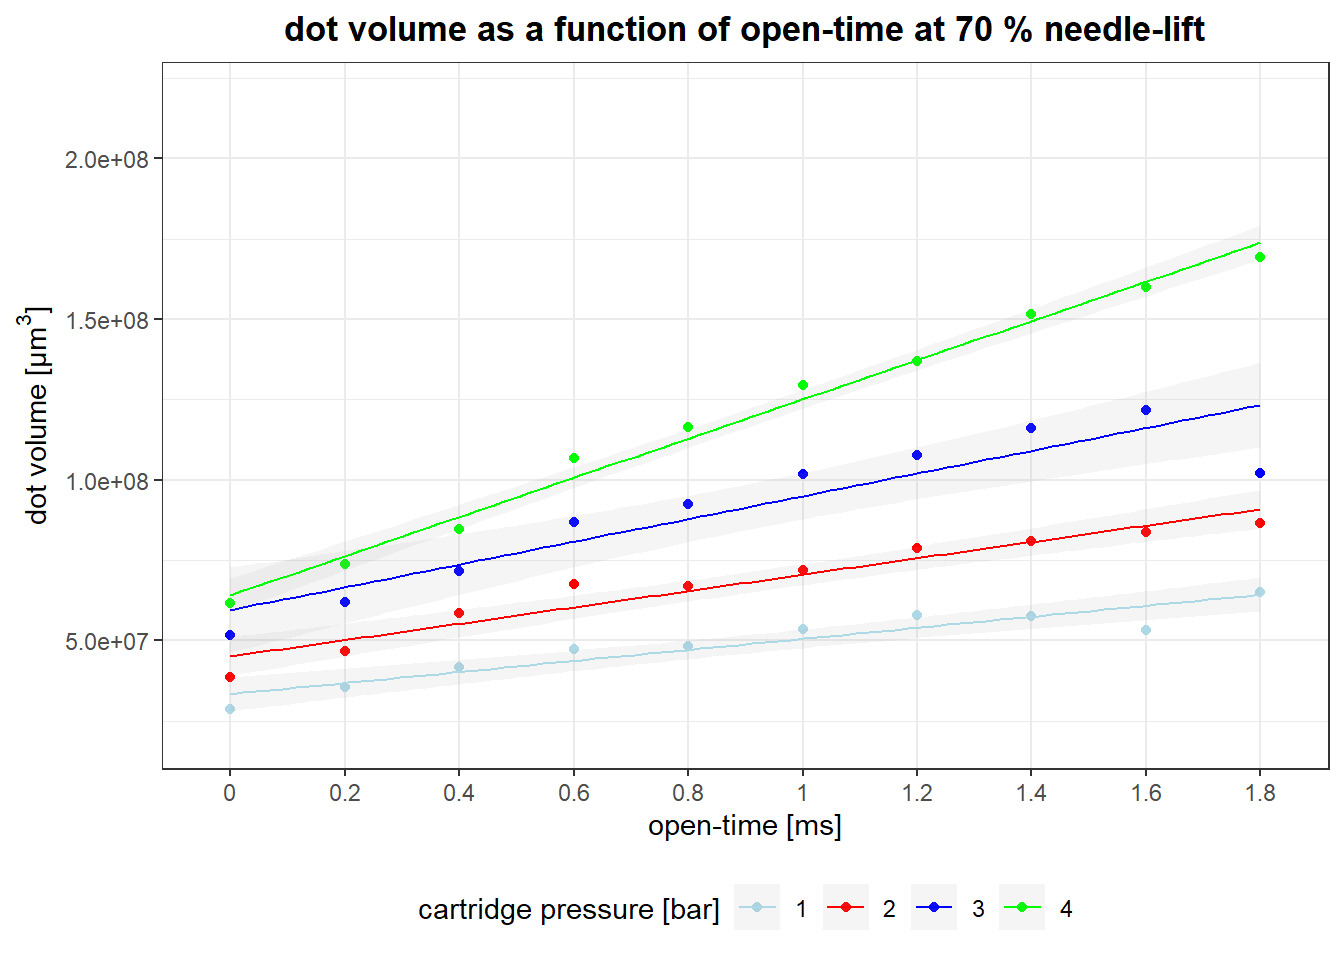
The dot volume shows a linear correlation with open-time and cartridge pressure. Comparing Figure 5 and Figure 6, a higher needle lift also yields an increased dot volume. Additionally, it becomes clear that, multiple parameter sets can achieve the same droplet volume. Regarding the application example we selected a parameter set that provides a dot volume of which is 0.34 % smaller than the target volume for assembling the 980 µm LED. The parameter set is shown in Table 3 and will be further optimized in III.B regarding its falling-time.
B. Experimental Group 2 (EG2)
In EG1, all parameters directly influencing dot volume were examined. Leaving the falling-time as the only unexamined parameter, it is investigated further in EG2. Therefore, all other parameters were fixed according to III.A (shown in Table 3) and falling-time is varied between 0.1 ms and 0.3 ms to determine its influence on the dot, conducting high-speed recordings, microscopic imaging and measurements of volume and radius.
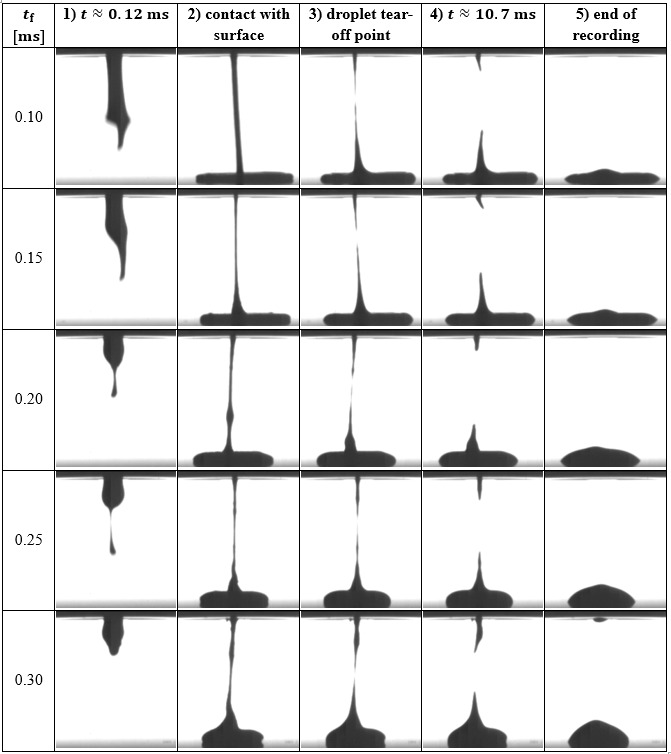
When comparing the droplet detachment qualitatively at different falling-times in Table 4 using high-speed imaging, it can be seen that longer falling-time results in material being ejected more slowly [as seen in 1) in Table 4]. Conversely, shorter falling-times impart higher kinetic energy, causing the material to spread thinner over a larger area upon impact [comparing 2) and 5)]. Additionally, shorter falling-times appear to shift the fluid pinching point closer to the nozzle leaving less material under the nozzle which leads to less material being withdrawn back into the nozzle. At a falling-time of 0.3 ms the tappet’s momentum is insufficient for a clean detachment, resulting in significant residual material under the nozzle [comparing 5)], which excluded 0.3 ms for the following experiments.
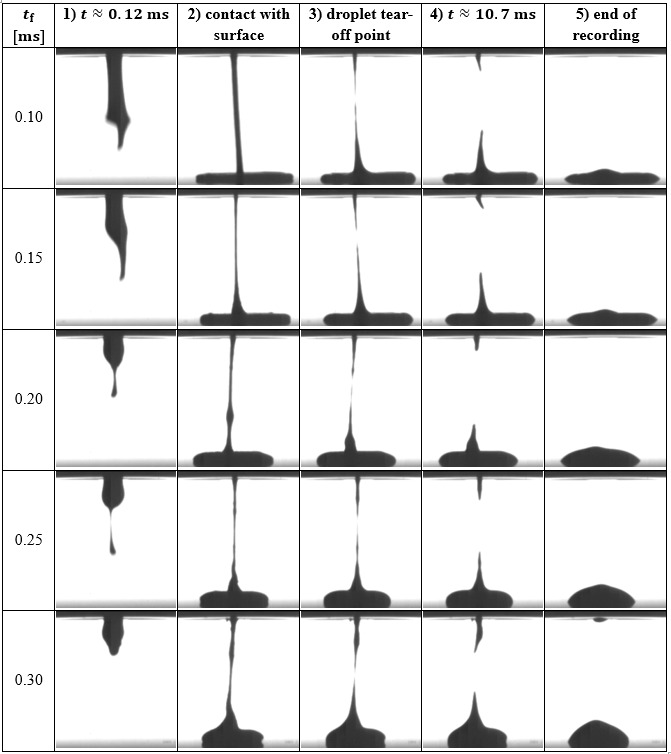
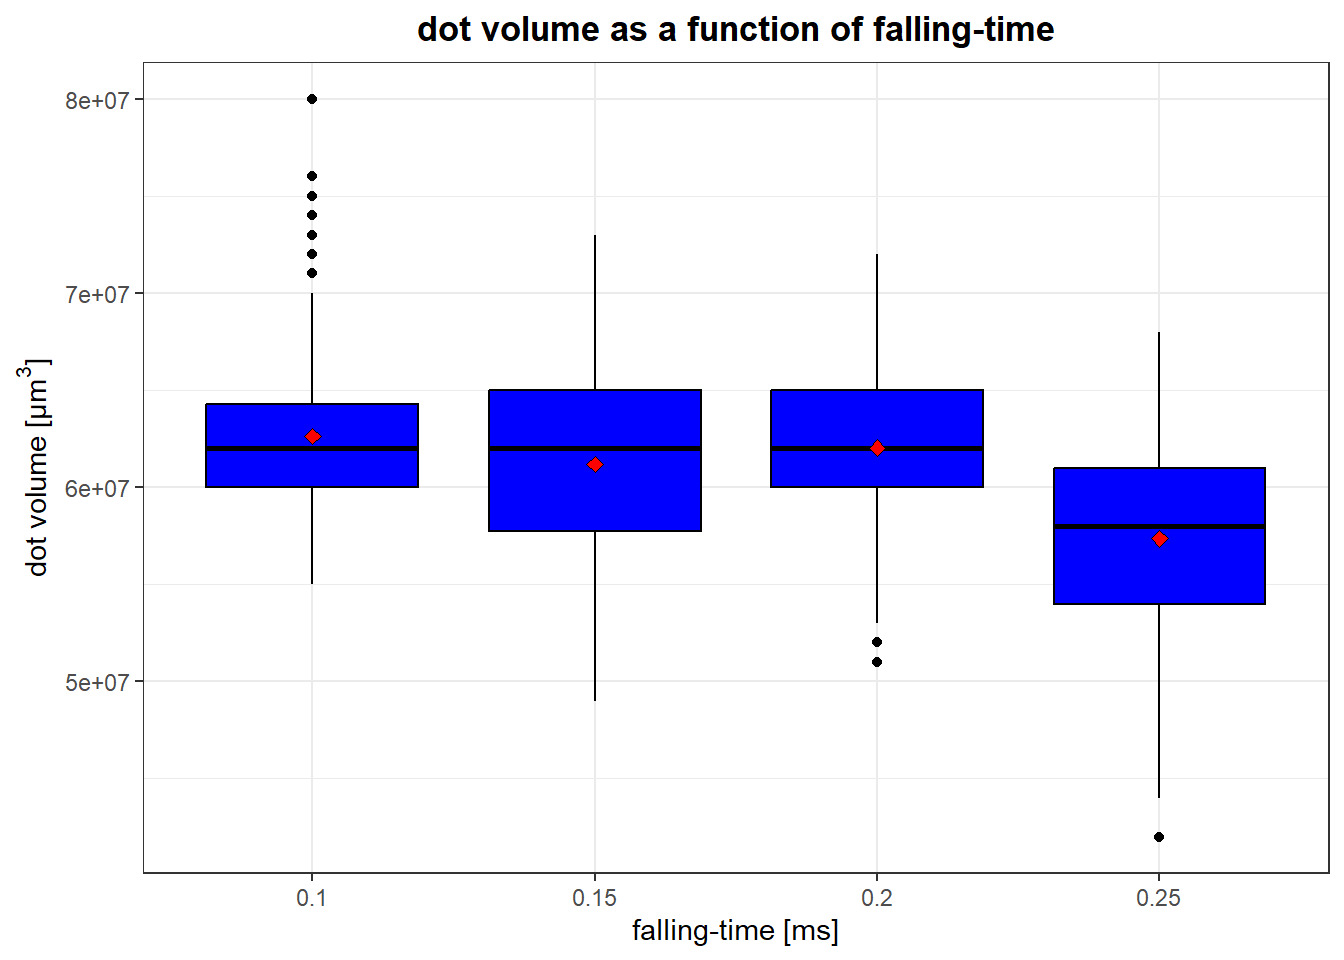
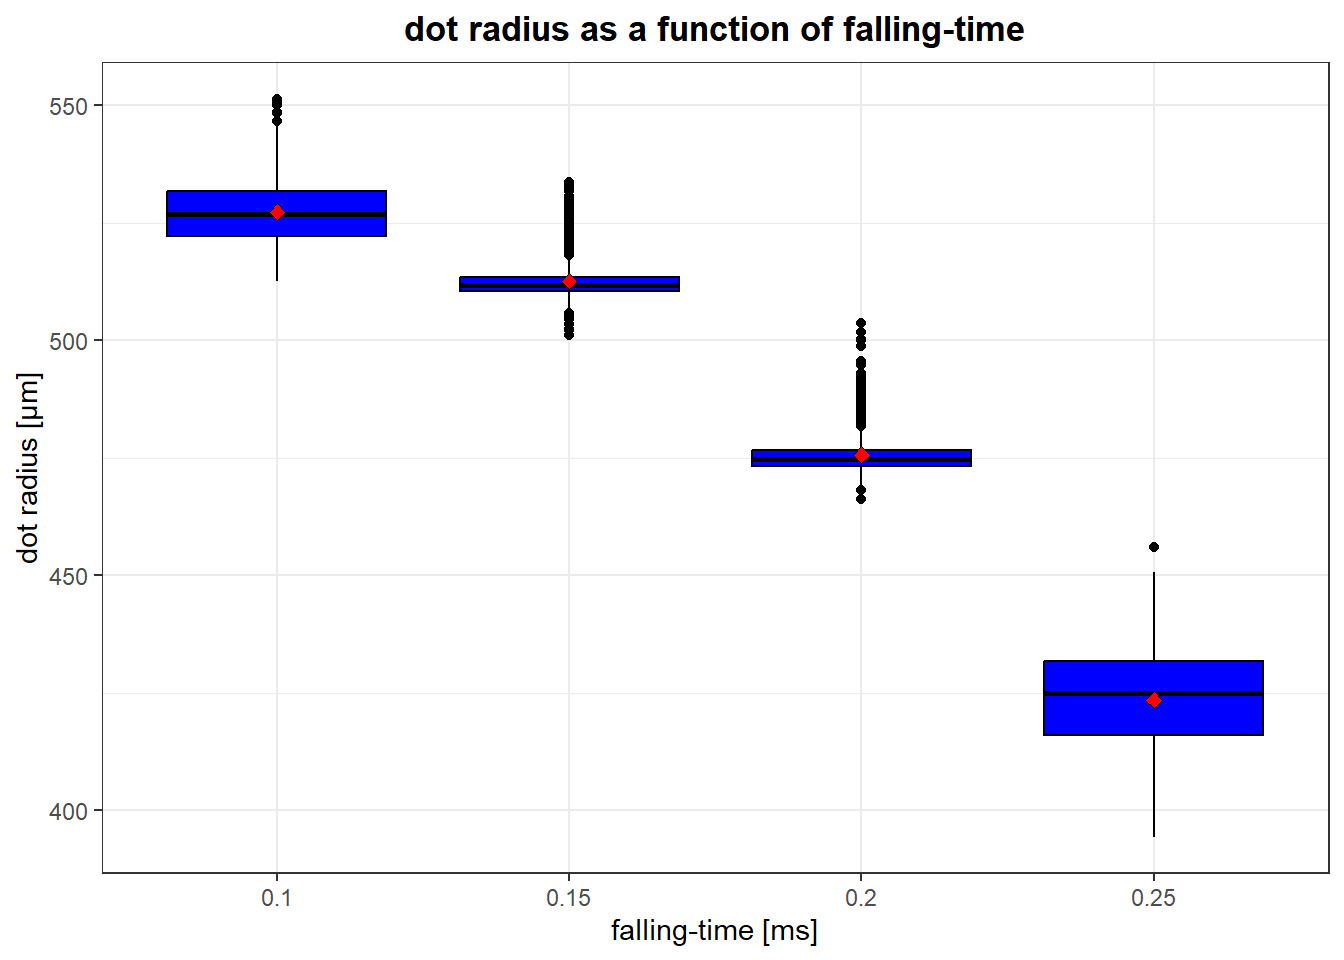
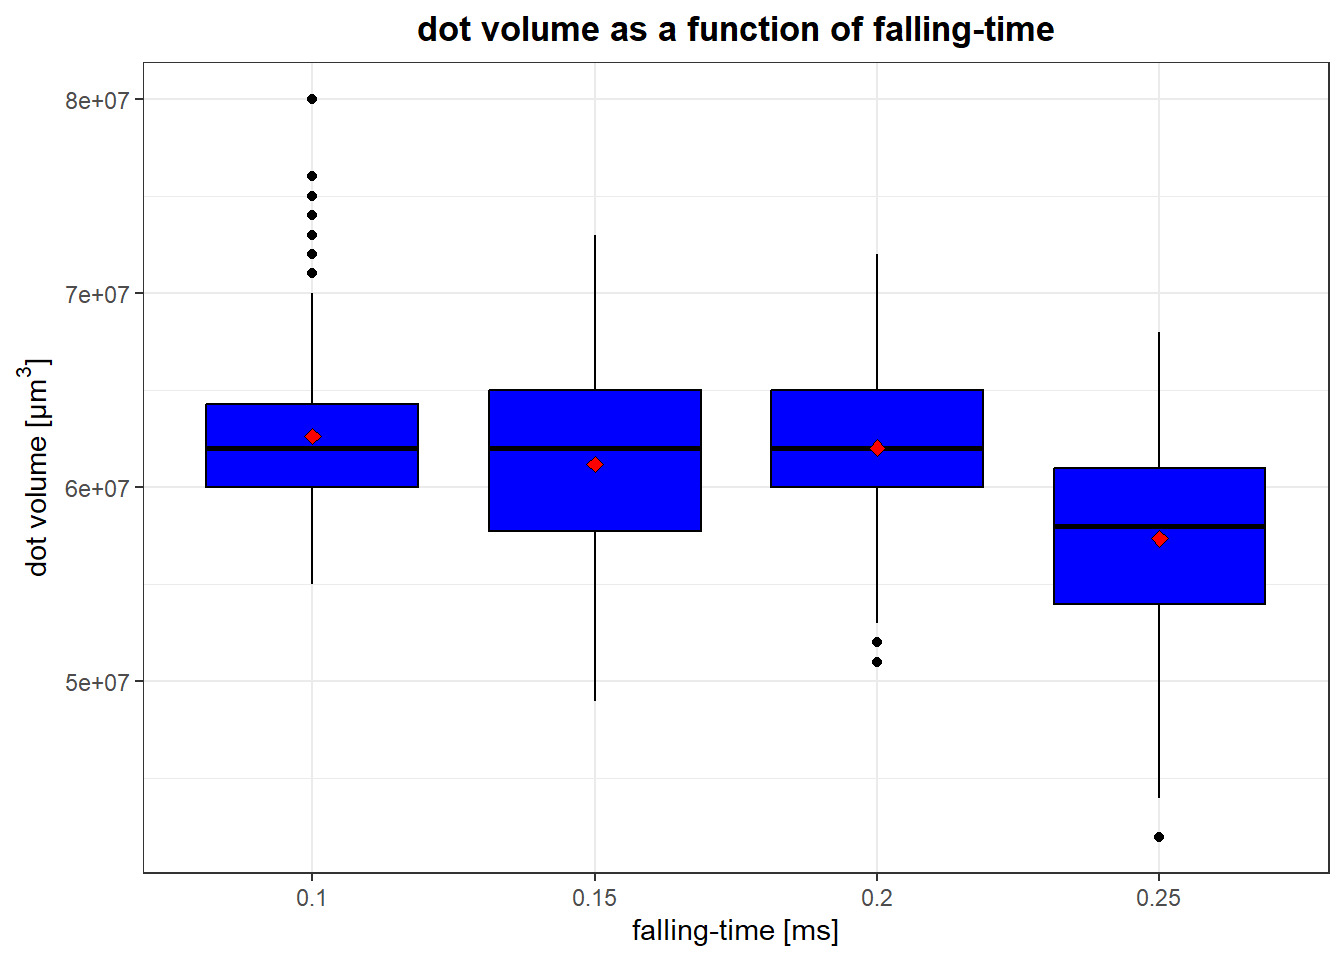
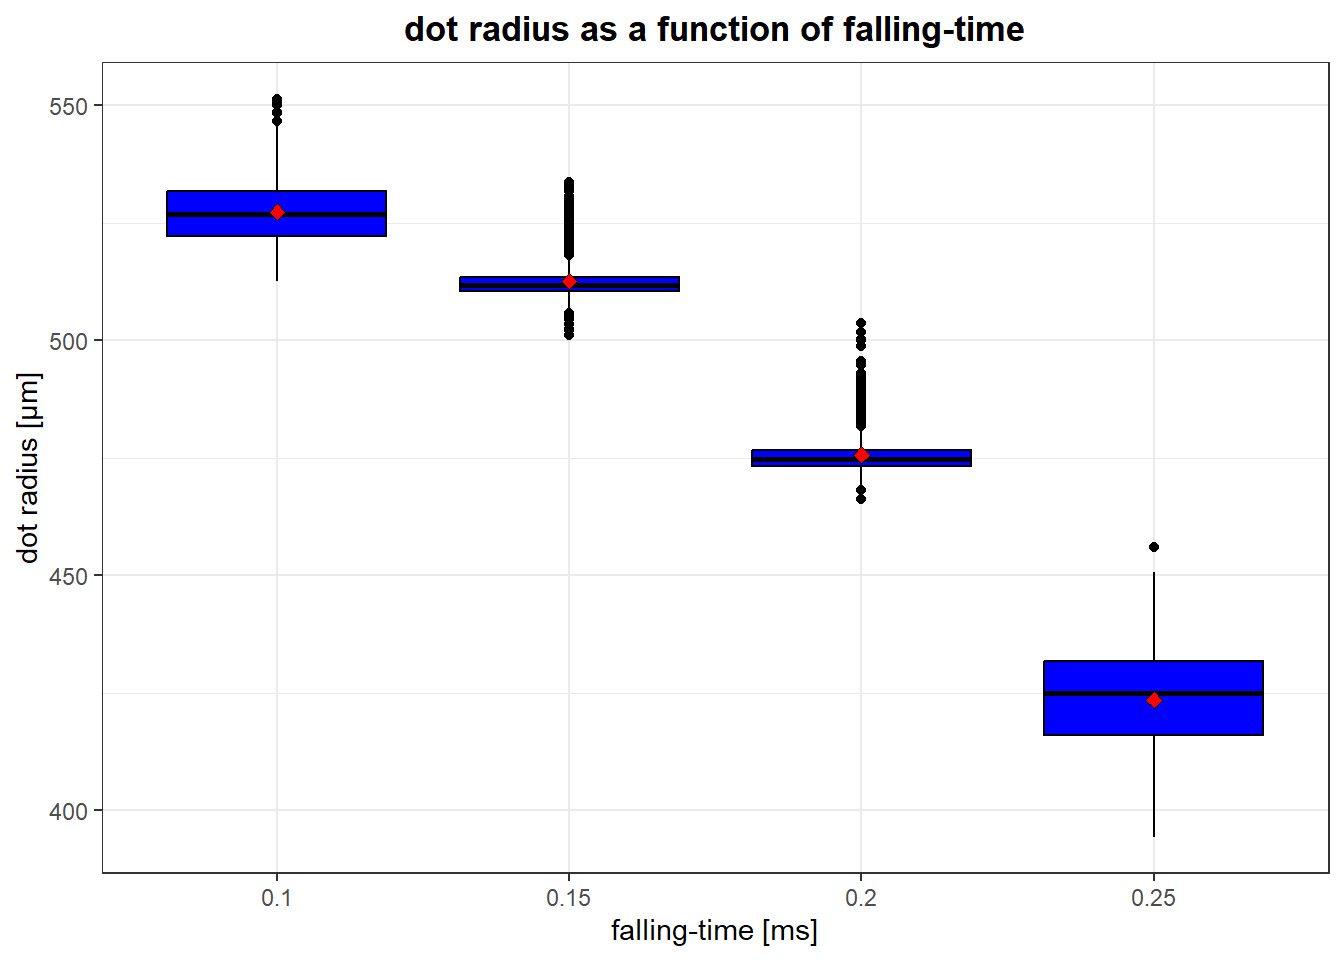
The insights found conducting high-speed recordings are reflected quantitatively in the measurement of dot volume and dot radius over falling-time by jetting 1024 dots per examined falling-time. Dot volumes were measured using an optical 3D profilometer, while the radii were determined using the manufacturing cell’s (Infotech FC1200) integrated high-resolution camera via a custom blob-detection algorithm. Confirming the high-speed camera study, dot volume remains nearly constant over the examined falling-times, as shown in Figure 7, while dot radius decreases with increasing falling-time, as is shown in Figure 8. This indicates that the falling-time primarily affects the shape of the jetted dots, influencing their radius and height, rather than their volume, which confirms the findings of the high-speed camera imagining numerically. The trends are explained by impact dynamics: a shorter falling-time transmits higher kinetic energy to the droplet, forcing it to spread wider over the substrate (larger radius, smaller height). This confirms falling-time as an effective parameter for tuning the dot shape (ratio of radius to height) without altering the total dispensed volume. Furthermore, for jetting materials containing ductile fillers, increasing the falling-time minimizes the kinetic energy applied to the material potentially lowering the risk for nozzle clogging from particle agglomeration.
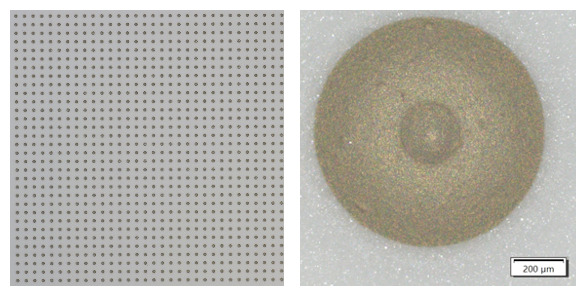
Regarding the sample application we selected a falling-time of for assembling the 980 µm LEDs as the standard deviation is minimal for dot volume and the second smallest for dot radius (see Table 5). Additionally, the dot radius is roughly half the size of 980 µm LED. Moreover, there are no missing dots nor satellites when jetting 1024 dots (see Figure 9, left) indicating a stable process.
__detail_(right).png)
C. Demonstration
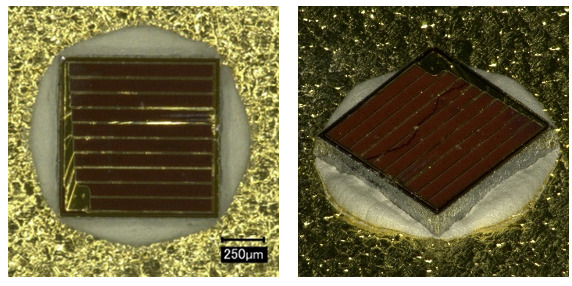
Concluding the validation of the process model, we assembled five 980 µm LEDs on a gold-plated DCB (Direct Bonded Copper) with the parameter set found in the preceding sections. As shown in Figure 10 the determined parameter set yields the correct dot volume for contacting the LEDs.
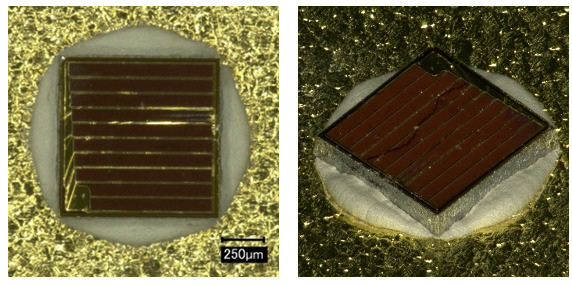
When measuring the mean wet dot volume it is 1.8 % smaller than the target volume. Moreover, the mean sintered volume is 5.6% greater than the target sintered volume, yielding Additionally, the average bondline thickness is 14 µm after placement and 8 µm after sintering.
This high degree of volumetric precision is critical to ensure functionality and reliability. Regarding functionality, the maximum volume is limited by the risk of paste climbing the LED sidewalls, which could result in electrical shorts. Regarding reliability a uniform and precisely defined bond line thickness is required to ensure thermal performance, prevent die cracking due to thermomechanical stress while simultaneously providing an interconnect with high shear strength, further investigated in IV.
IV. Assessment
In this section we analyze the sintering paste reliability through shear tests. After assembling 980 µm LEDs in III.C we move on to smaller LEDs of 313 µm, as we target smallest depot volumes and hence smallest components. We compare their shear strength when sintered under air and nitrogen. To assess long-term reliability, we conducted temperature cycling (TCT) and high-temperature storage tests (HTS) comparing the results with initial samples. TCT cycling was done between -55 °C and 125 °C for 250, 500, and 1000 cycles. HTS was performed at 200 °C for 250, 500 and 1000 hours. An overview for all samples is given in table Table 6.
A. Assembly of samples
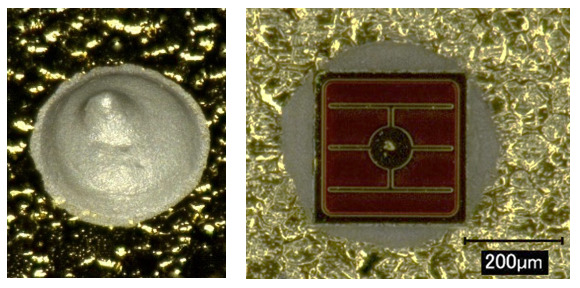
For assembling the 313 µm LEDs, first we determined the necessary dot volume and identified the parameter set required to achieve this, using the approach developed under III. Therefore, we jetted a single droplet on a gold-plated DCB with a diameter of ~385 µm, as shown in Figure 11 (left).
After jetting, the LEDs are placed using a manual fineplacer equipped with a specifically designed and manufactured placement tool setting the bondline thickness to 20 µm. The LEDs are then sintered at 200 °C for 2 hours, as shown in Figure 11 (right), with one half sintered in an air atmosphere and the other half in a nitrogen atmosphere.
_and_313_m_led_(right)_sintered.png)
B. Shear tests
All LEDs were sheared at room temperature using a Dage 4000 bond tester equipped with a BS 5 kg cartridge and a SHEAR-187-050 chisel. The test speed was set to 300 µm/s with the shear height set to 100 µm.
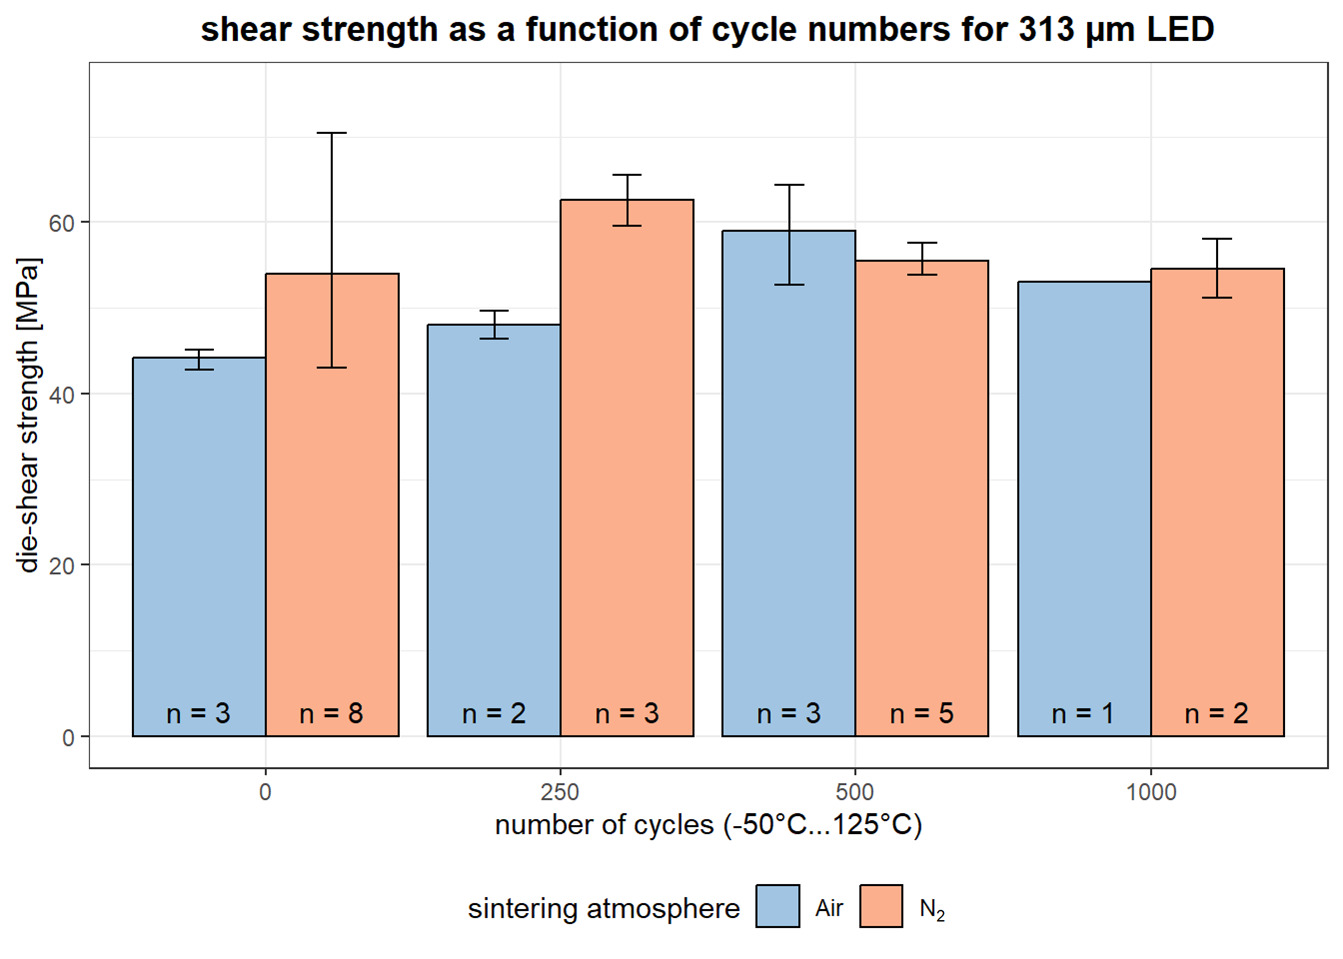
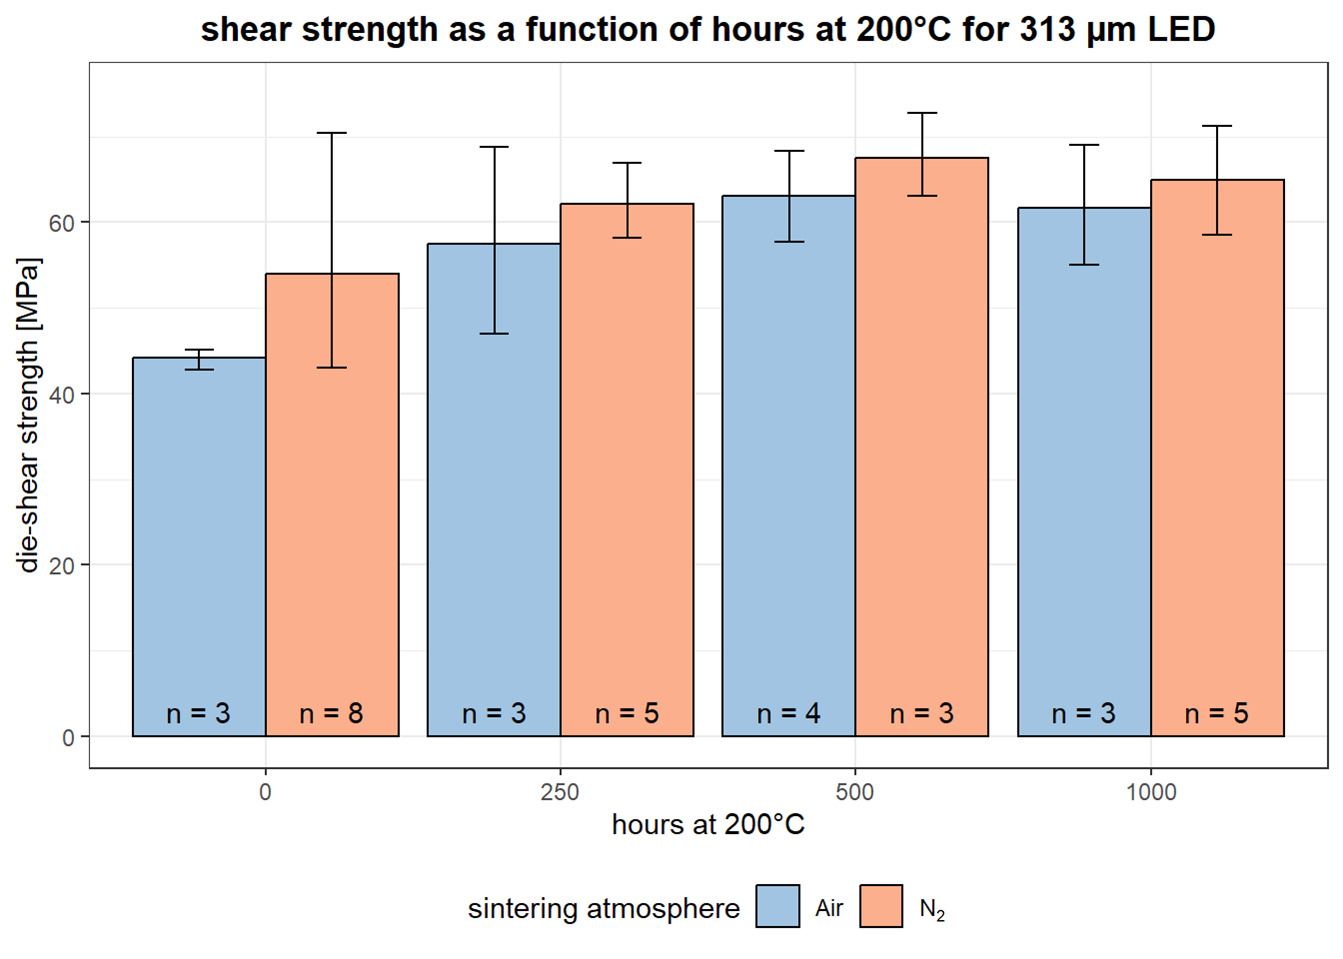
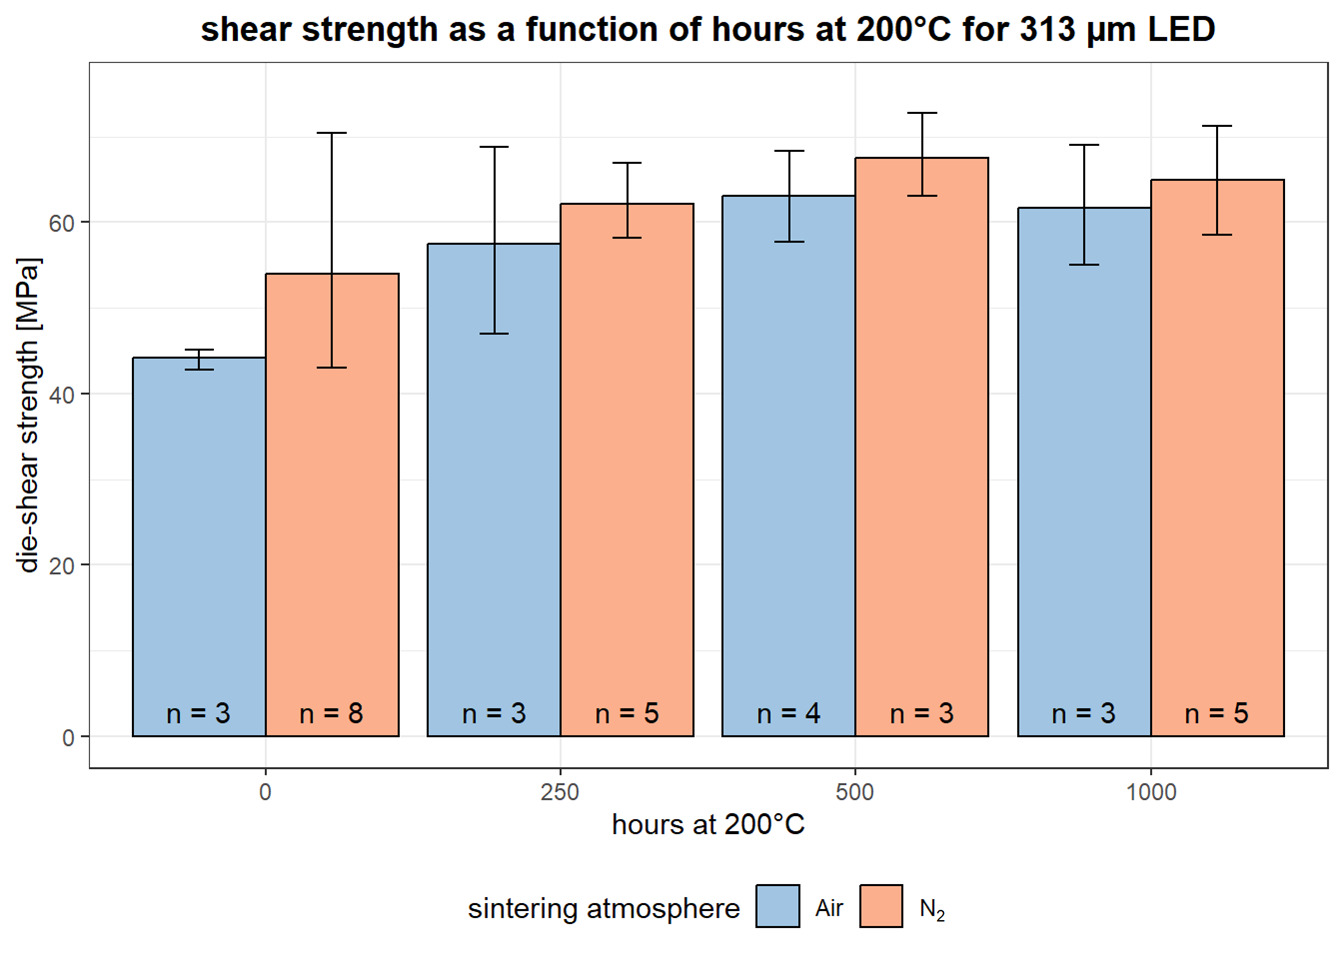
The results of the temperature-cycling tests are shown in Figure 12, while the results of the high-temperature storage tests are presented in Figure 13. Hereby only the shear-test results are included where the sintered interface failed. From the initial 20 values, 12 were included. For temperature cycling tests, 16 of 30 were included, and for high-temperature storage tests, 23 of 30 values were included. Both tests show a higher die-shear strength for LEDs sintered in a nitrogen atmosphere, excluding 500 cycles TCT. Initially the die-shear strength is ~44 MPa when sintered in air atmosphere and ~54 MPa when sintered in N2-atmosphere. Also, there is no significant decrease in die-shear strength after 1000 cycles as well as after 1000 hours at 200°C (see Table 7), pointing towards promising long-term reliability potential of the sintering paste formulation.
.png)
C. Conclusion
The present work explores methods for jet dispensing pressureless silver sintering paste. A developmental formulation of Nano Join GmbH’s microparticle-based Ag sintering paste is used for method and process development. The paste is characterized rheologically in Section II.A, which determines the maximum jetting temperature. Next, the jet-dispensing process is examined in depth in Section II.B, and a volumetric model is created to highlight the influence of different parameters on the jetted dot. Cartridge pressure, needle lift, rise-time, and open-time were found to directly impact the volume of material jetted, leaving falling-time as a free, volume-neutral parameter.
These insights were validated in Section III by employing two experimental groups and establishing a method for identifying the ideal parameter set for a specific application, as demonstrated with 980 µm LEDs. III.A reveals a linear interrelationship between open-time and dot volume. III.B confirms that falling-time is a volume-neutral parameter that influences the shape of the jetted dots in terms of both radius and height.
In Section IV, the method for identifying the optimal parameter set is applied to assemble 313 µm LEDs, showcasing the method’s universality. Long-term reliability assessments were performed using temperature cycling tests and high-temperature storage. Die-shear strengths for sintering in air and nitrogen atmospheres were compared, showing higher shear strength when sintered in nitrogen. Initially, the average shear strength is ~44 MPa in air and ~54 MPa in nitrogen. Furthermore, no decrease in die shear strength was observed for either temperature cycling or high-temperature storage. After 1,000 cycles ranging from -50 °C to 125 °C, the average shear strength was ~53 MPa for air and ~54.6 MPa for nitrogen. Additionally, the average shear strength after 1,000 hours at 200 °C is ~61.7 MPa for air and ~65 MPa for nitrogen.
In summary, we present a methodology for accurately forming dots of a desired volume, allowing to adjust the diameter using the falling-time of the tappet as a free parameter. We successfully mitigate well-known issues of particle agglomeration and nozzle clogging, paving the way for jet-dispensing of materials with ductile particles – such as NanoJoin’s Ag sinter paste – for small components, i.e. for optoelectronic applications.
Acknowledgment
Parts of this work were performed within the project NanoLite funded by the German Federal Ministry for Economic Affairs and Climate Action (Bundesministerium für Wirtschaft und Klimaschutz, BMWK) within the ZIM-program (Zentrales Innovationsprogramm Mittelstand) under grant No. KK5076118AG1.